
Theme 5
Environmental Innovation
Policy questions and key messages
- How does the UK compare in environmental and energy technology research and development (R&D) investment?
- How is R&D expenditure translating into patenting performance?
- Is the UK capturing the economic potential of the transition towards environmental sustainability?
Key findings
- The government R&D budget allocated to environment and energy innovation in the UK (as a share of total R&D budget) is similar to other leading nations, and has a positive correlation with the country’s ranking in environment-related patent applications
- The UK had the sixth highest government budget allocation for R&D in environment and energy innovation among OECD countries in 2020. This represented 6% of the UK’s total budget allocation for R&D, higher than that of the United States (3%), but lower than Japan (8%), Germany (8%), Korea (8%), and France (9%).
- The UK ranked seventh in the world by the number of environment-related patent applications according to OECD data, behind Japan, the US, Germany, Korea, China, and France, and ahead of Taiwan, Canada and Italy.
- Half of the environmental goods and services sub-sectors in the UK have grown over the last decade (2010-2019) in terms of GVA, while the rest have declined
- Output in the UK environmental goods and services sector (EGSS) was estimated to be £89.0 billion in 2019 (up 4.4% from 2018), while gross value added was estimated to be £45.2 billion in 2019 (up 5.4% from 2018), and employment registered 394,900 full-time equivalent employees in 2019 (down 4.7% from 2018).
- The production of renewable energy was the activity in 2019 with the largest share of total EGSS output (22.5%) and GVA (26.4%).
The activity of waste had the largest share of total EGSS employment (29.3%) and the second-largest share of total EGSS output (17.8%) in 2019. - The UK environmental goods and services sector performs strongly at European level, ranked 2nd by GVA only behind Germany
Output in the UK environmental goods and services sector was the 3rd highest in Europe in 2019, after Germany and France.
Gross value added in the UK EGSS was the 2nd largest in Europe in 2019, after Germany. - Exports from the UK EGSS were the 3rd largest in Europe in 2019, after Germany and Austria.
- Employment in the UK EGSS was the 5th highest in Europe in 2019, after Germany, France, Spain and Italy.
UK carbon emissions by sector
Note: UK resident basis, greenhouse gases under the Kyoto Protocol
Source: ONS (2022). Atmospheric emissions: greenhouse gases by industry.
- The UK is one of the top 20 emitters globally and has above-average emissions per capita, even before accounting for emissions embedded in imported goods. The UK’s emissions were the 18th largest in the world in 2019.[1]
- In 2019, four industry sections accounted for 73% of carbon emissions in the UK: consumer expenditure (26%); electricity, gas, steam and air conditioning supply (16%); transport and storage (16%); and manufacturing (15%).
- Carbon emissions abatement represents a significant challenge but also a significant opportunity for innovation, together with other legally binding environmental targets set by the government’s Environment Act:[2]
- Halt the decline in species populations by 2030;
- Restore precious water bodies to their natural state;
- Deliver net zero ambitions and boost nature recovery by increasing tree and woodland cover to 16.5% of total land area in England by 2050;
- Halve the waste per person that is sent to residual treatment by 2042;
- Cut exposure to the most harmful air pollutant to human health – PM2.5;
- Restore 70% of designated features in Marine Protected Areas to a favourable condition by 2042.
Note: [1] World Bank (2022) Total greenhouse gas emissions (kt of CO2 equivalent), 2019 figures. [2] DEFRA (2023) . Environment Act.
Government budget allocations for R&D
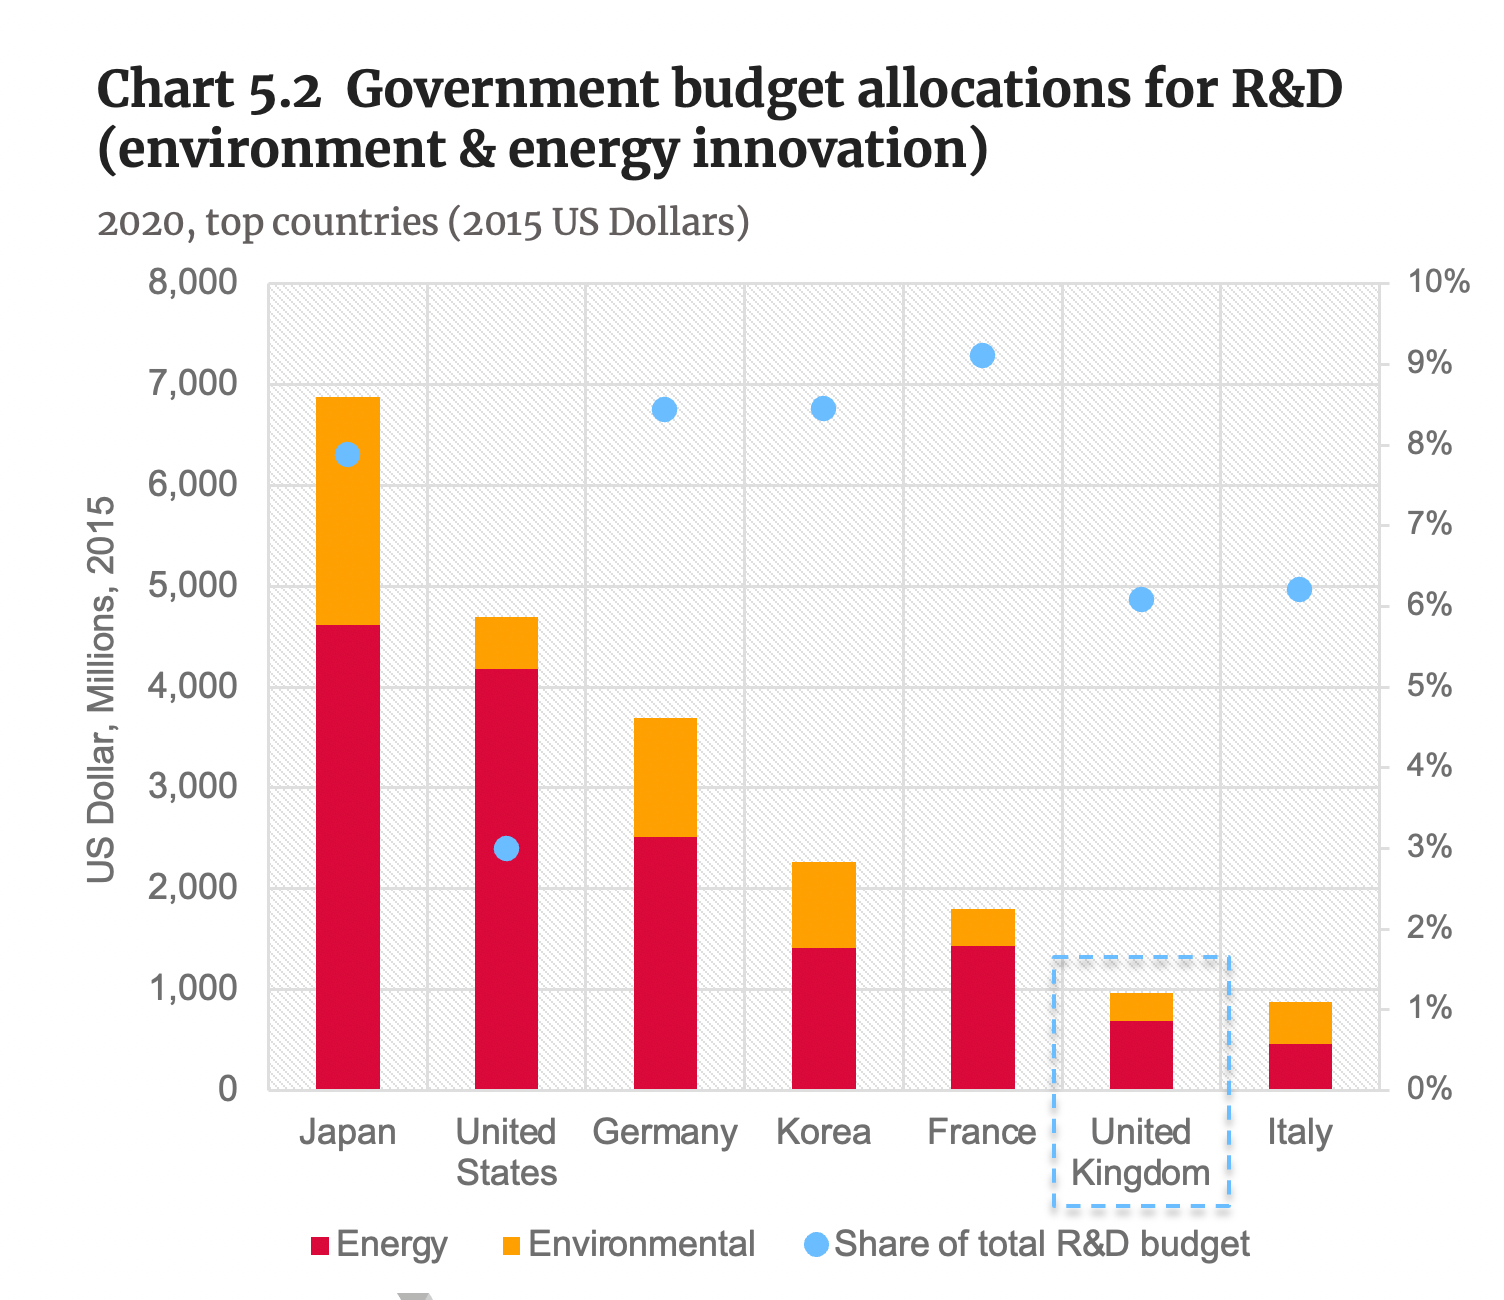
Source: OECD.Stat. Accessed on 30 January 2023.
- In absolute numbers, the UK had the sixth highest government budget allocation for R&D in environment and energy innovation among OECD countries in 2020.[1]
- This represented roughly 6% of the UK’s total budget allocation for R&D. This share is higher than that of the United States (3%), but lower than other leading countries such as Japan (8%), Germany (8%), Korea (8%), and France (9%).
- Government budget allocations for R&D in environmental innovation are significantly lower than allocations for energy R&D in all leading nations, except for Italy where both categories show similar budget allocations in absolute numbers.
Note: [1] The OECD presents data on Government budget allocations for R&D (GBARD) by socio-economic objective (SEO), using the NABS 2007 classification. Geographic coverage includes OECD members plus Romania, Russian Federation and Chinese Taipei.
Innovation in environment-related technologies
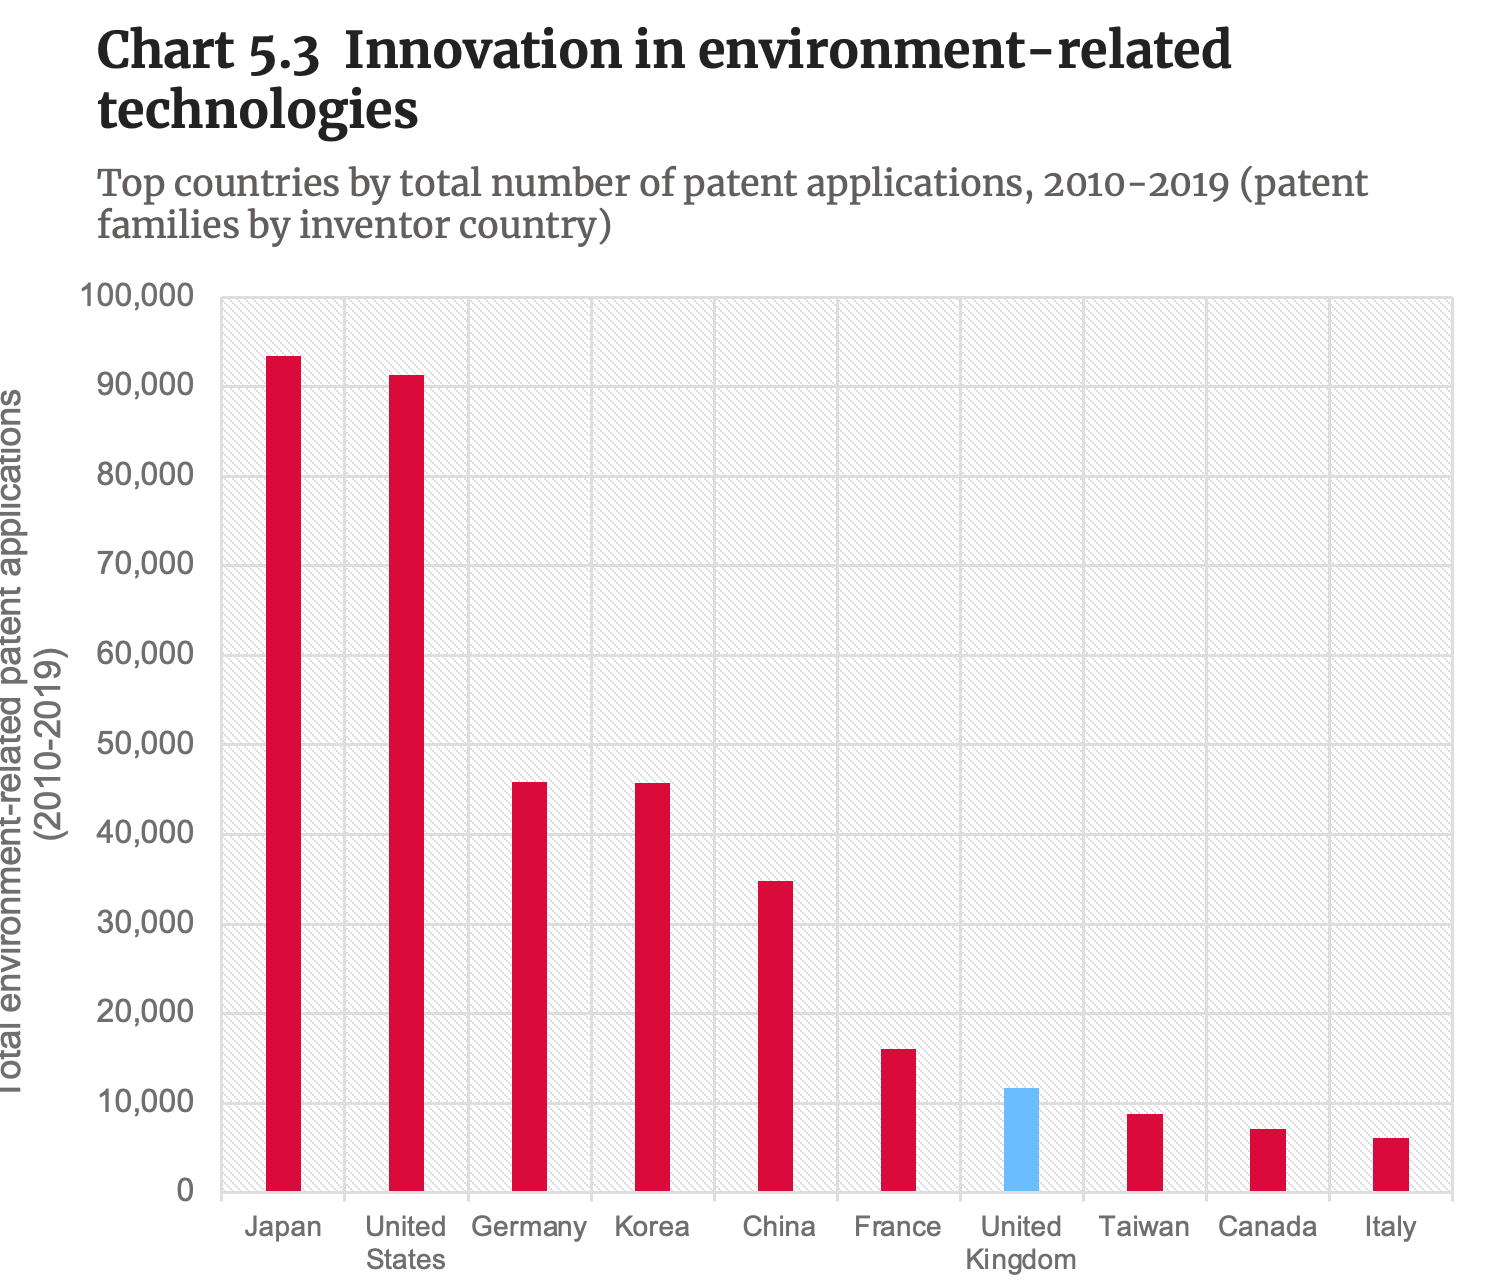
Source: OECD.Stat. Accessed on 30 January 2023
- The UK ranks seventh in the world by the number of environment-related patent applications, behind Japan, the US, Germany, Korea, China, and France, but ahead of Taiwan, Canada and Italy.[1]
- Technologies covered under the OECD’s “environment-related technologies” group include:
- Environmental management;
- Climate change mitigation technologies related to energy generation, transmission and distribution;
- Capture, storage, sequestration or disposal of greenhouse gases;
- Climate change mitigation for transport;
- Climate change mitigation for buildings;
- Wastewater treatment and waste management;
- Climate change mitigation in the production or processing of goods;
- Climate change mitigation in information and communication technologies.
Note: [1] The patent family concept (defined as all patent applications protecting the same ‘priority’) is applied to all statistics presented here (i.e. counts of patent families by inventor country). Consistent with other patent statistics provided in OECD.Stat, only published applications for “patents of invention” are considered (i.e. excluding utility models, petty patents, etc.). The relevant patent documents are identified using search strategies for environment-related technologies.
Eco-innovation performance
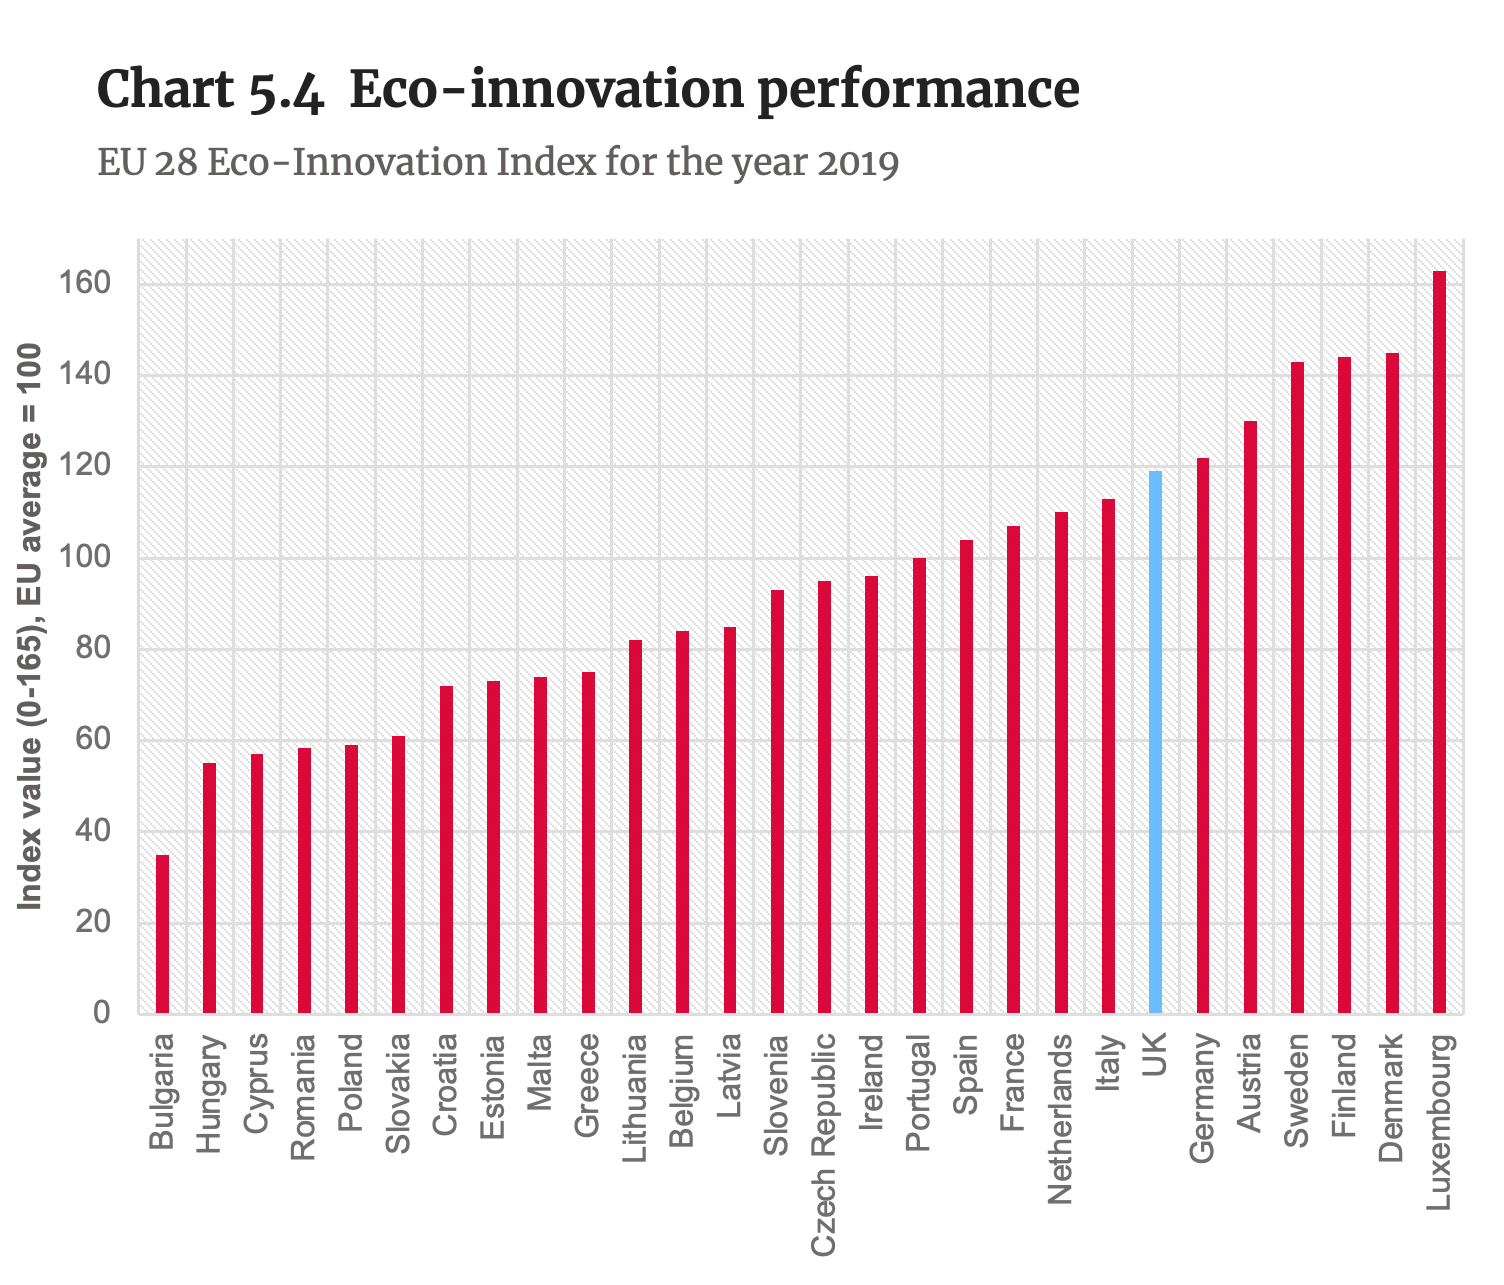
Note: UK data no longer available after 2019.
Source: European Commission (2023). Eco-innovation scoreboard 2019.
- The Eco-Innovation Index gathers data on eco-innovation performance across the EU and beyond, thus helping to monitor and evaluate progress made since 2010.[1]
- The Index included data for the UK up to 2019. In this year, the highest (aggregated) Eco-Innovation Index belonged to Luxemburg (index value: 165, EU-average=100), followed by Denmark, Finland, Sweden, Austria, Germany and the UK.
- The UK’s position on the Eco-Innovation Index increased from 11th to 7th between 2017 and in 2019.
- Among the indicators for the Eco-Innovation Index, the UK showed a strong performance in resource efficiency (i.e. material-, water- and energy productivity, and GHG intensity), where it ranked 3rd in 2019.
- The UK was above the EU average in environmental and energy R&D, R&D personnel, early stage green investments, innovating enterprises obtaining environmental benefits, and ISO 14001 companies.
- The country ranked slightly below the EU average for relevant patents and academic publications per million inhabitants, media coverage of eco-innovation topics per electronic media source, exports, revenues and employment from the eco-industries and circular economy.
UK environmental goods & services sector (EGSS)
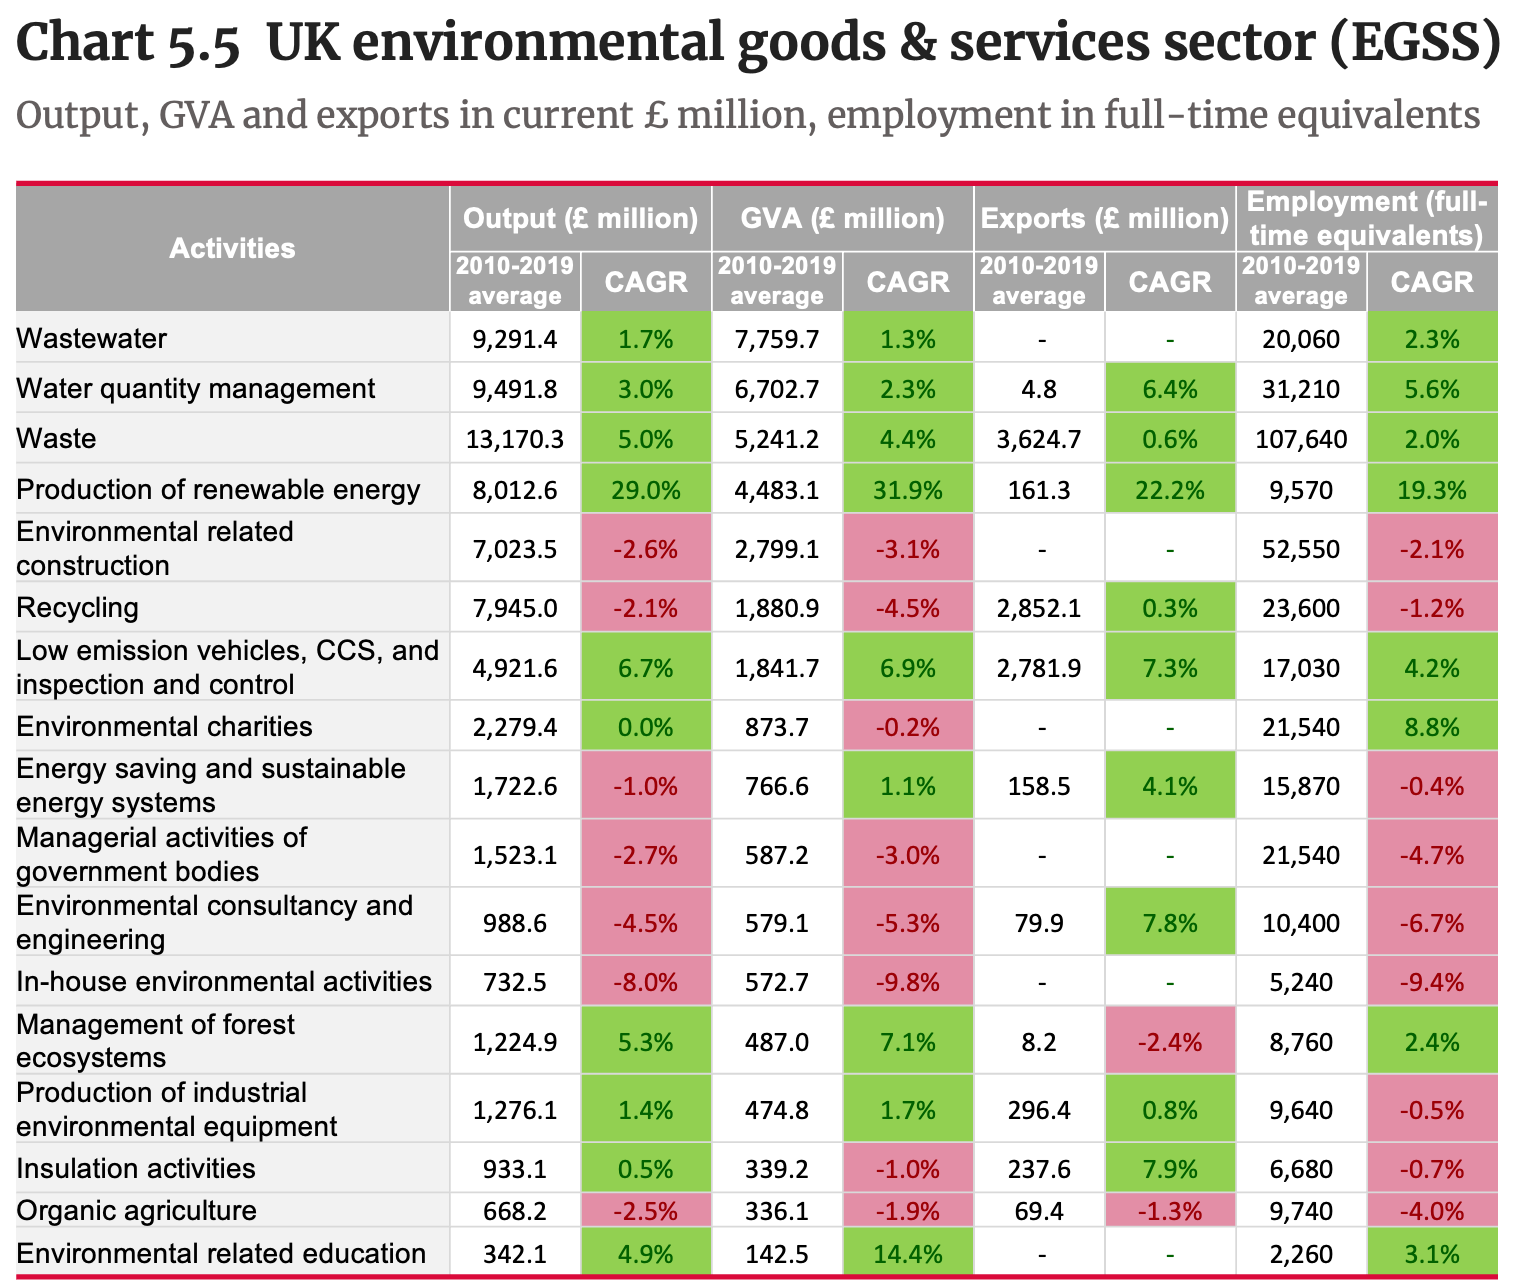
Source: ONS (2022). Environmental goods and services (EGSS) estimates.
- The environmental goods and services sector (EGSS) estimates from the ONS follow the UN System of Environmental- Economic Accounting (SEEA). It measures 17 activities across the economy that produce goods and services for environmental protection and resource management purposes.[1]
- As defined by the ONS and international guidelines, the environmental goods and service sector includes “areas of the economy engaged in producing goods and services for environmental protection purposes, as well as those engaged in conserving and maintaining natural resources“. These areas of the economy must also produce the goods and services for primarily environmental reasons.
- Output in the UK environmental goods and services sector (EGSS) was estimated to be £89.0 billion in 2019, up 4.4% from 2018.[2]
Gross value added (GVA) in the UK EGSS was estimated to be £45.2 billion in 2019, up 5.4% from 2018.[2] - Employment in the UK EGSS was estimated to be 394,900 full-time equivalent (FTE) employees in 2019, down 4.7% from 2018.[2]
- The production of renewable energy was the activity in 2019 with the largest share of total EGSS output (22.5%) and GVA (26.4%).[2]
- The activity waste had the largest share of total EGSS employment (29.3%) and the second-largest share of total EGSS output (17.8%) in 2019.[2]
Note: [1] EGSS estimates use a range of data sources, including the ONS’ low carbon and renewable energy (LCREE) estimates, supply and use tables (SUT), the annual business survey (ABS), and the business register and employment survey (BRES). [2] ONS (2022). Environmental goods and services (EGSS) estimates.
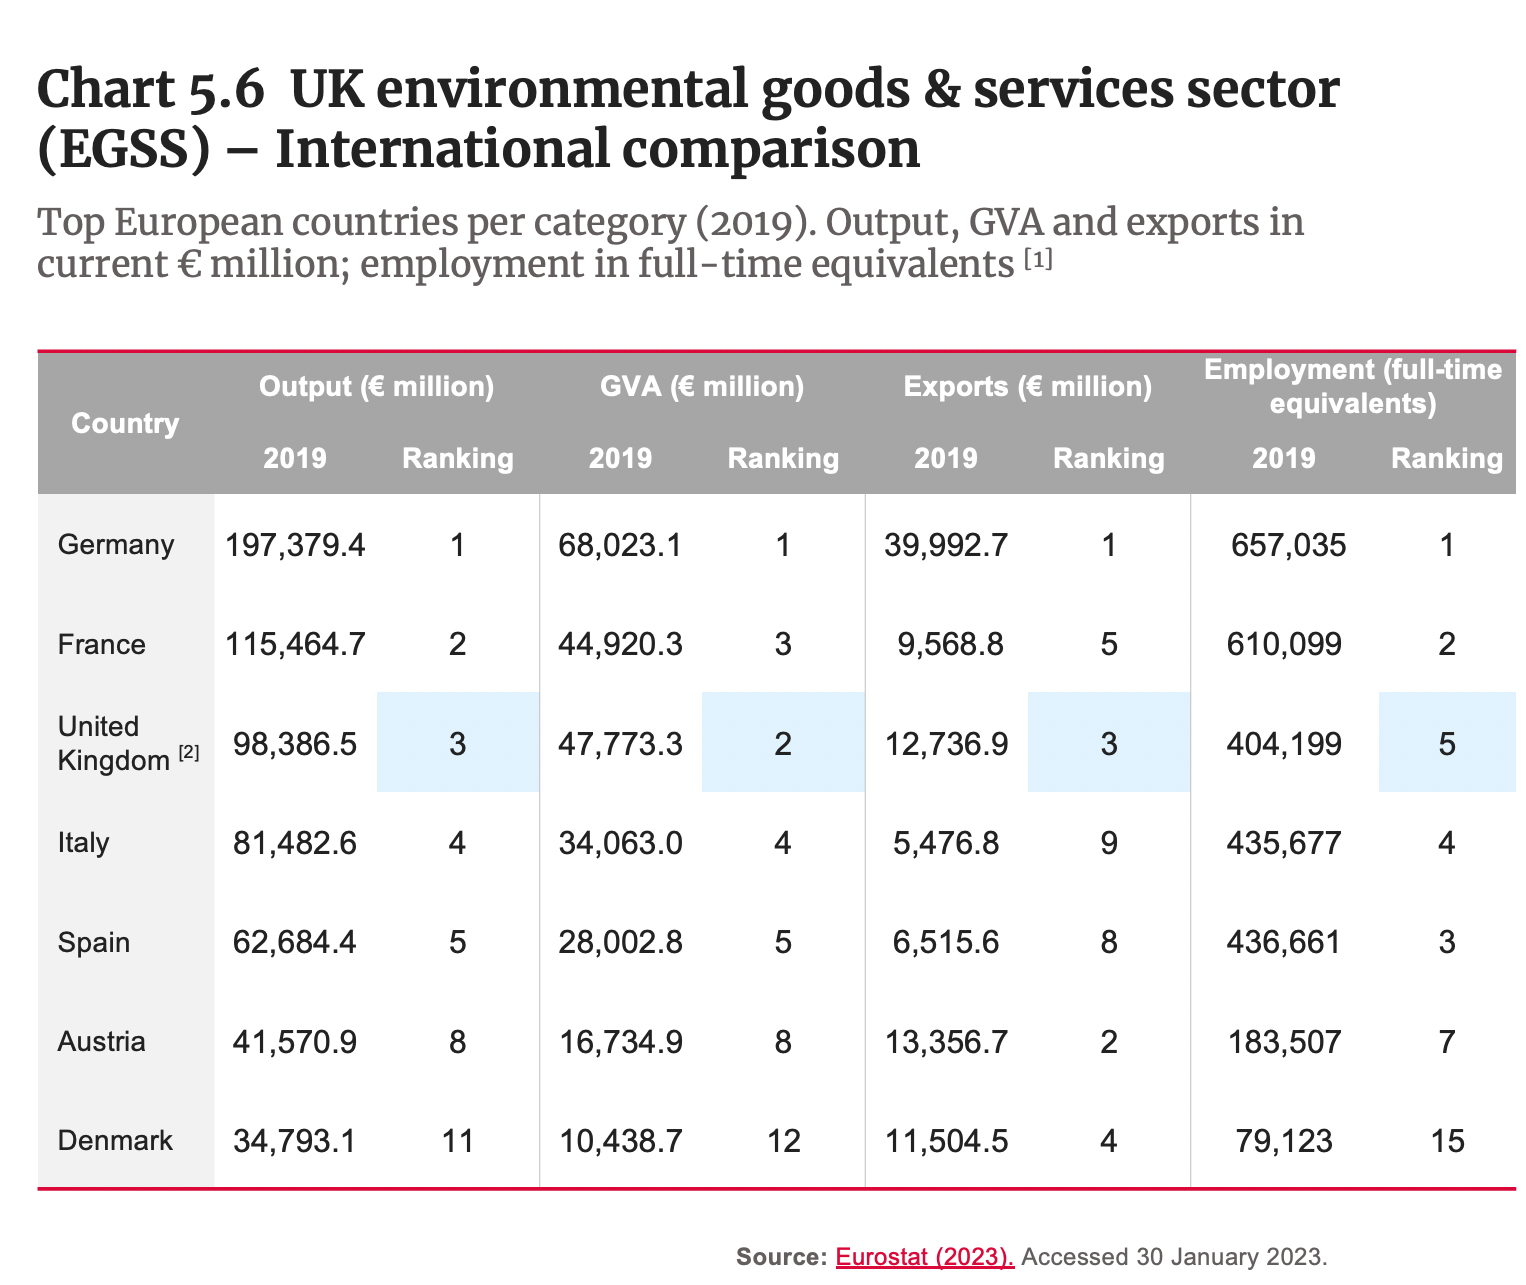
UK environmental goods & services sector (EGSS) – International comparison
Source: Eurostat (2023). Accessed 30 January 2023.
Note: [1] Eurostat data coverage includes EU27 countries plus selected European nations. [2] UK data for 2018.
- The UK performs strongly in terms of EGSS output, GVA, exports and employment when compared to other leading European nations.
- Output in the UK environmental goods and services sector (EGSS) was the 3rd highest in Europe in 2019, after Germany and France.
- Gross value added (GVA) in the UK EGSS was the 2nd largest in Europe in 2019, after Germany.
- Exports from the UK EGSS were the 3rd largest in Europe in 2019, after Germany and Austria.
- Employment in the UK EGSS was the 5th highest in Europe in 2019, after Germany, France, Spain and Italy.


