
Theme 1
Structure and Performance of the UK Economy
Policy questions and key messages
- How does productivity vary across UK regions and countries?
- How has the economic structure of the UK regions changed in the last few years?
- Are these changes affecting economic performance?
Substantial and widening productivity gaps are observed between London and the rest of the UK.
- London and the South East of England are the UK regions with the highest labour productivity levels, showing annual values of £80,034 and £59,709 value added per job in 2019. In contrast, Wales, the North East of England, and Yorkshire and the Humber have among the lowest productivity levels, around £47,000 in 2019.
- In 1999 labour productivity in Wales represented 65% of that observed in London; however, in 2019 Wales’ productivity accounted for only 58% of that of London.
Spatial disparities in sectoral productivity levels are particularly large in agriculture, forestry and fishing; arts, entertainment and recreation; professional, scientific and technical activities; and financial and insurance activities.
- London’s sectoral productivity levels are above the UK average for all sectors except manufacturing and agriculture. The productivity of London’s professional, scientific and technical activities is 2.4 times larger than that observed in Wales, the UK area with the lowest productivity level in this sector.
- Substantial gaps are also observed in the pace of productivity growth in the information and communication sector. The North East of England (16.2%) and Wales (13.6%) saw the fastest growth between 1999 and 2019. In contrast, London saw the slowest growth (6.0%).
In the last two decades, the expansion of service sectors at the expense of higher productivity sectors, such as manufacturing, has slowed down overall productivity growth and contributed to widening productivity gaps across the UK.
- Between 1999 and 2019 knowledge- and labour-intensive services expanded, while manufacturing reduced its participation in the UK economy. However, since service activities tend to have productivity levels below the average of the total economy and show slower productivity growth, their expansion has slowed down productivity growth.
- The most negative impacts from the shrinkage of manufacturing are observed in the East Midlands, the North West, the North East and the West Midlands, where the decline of manufacturing cost these regions a percentage point, on average per year, between 1999 and 2019.
Structure of the UK economy, 2021
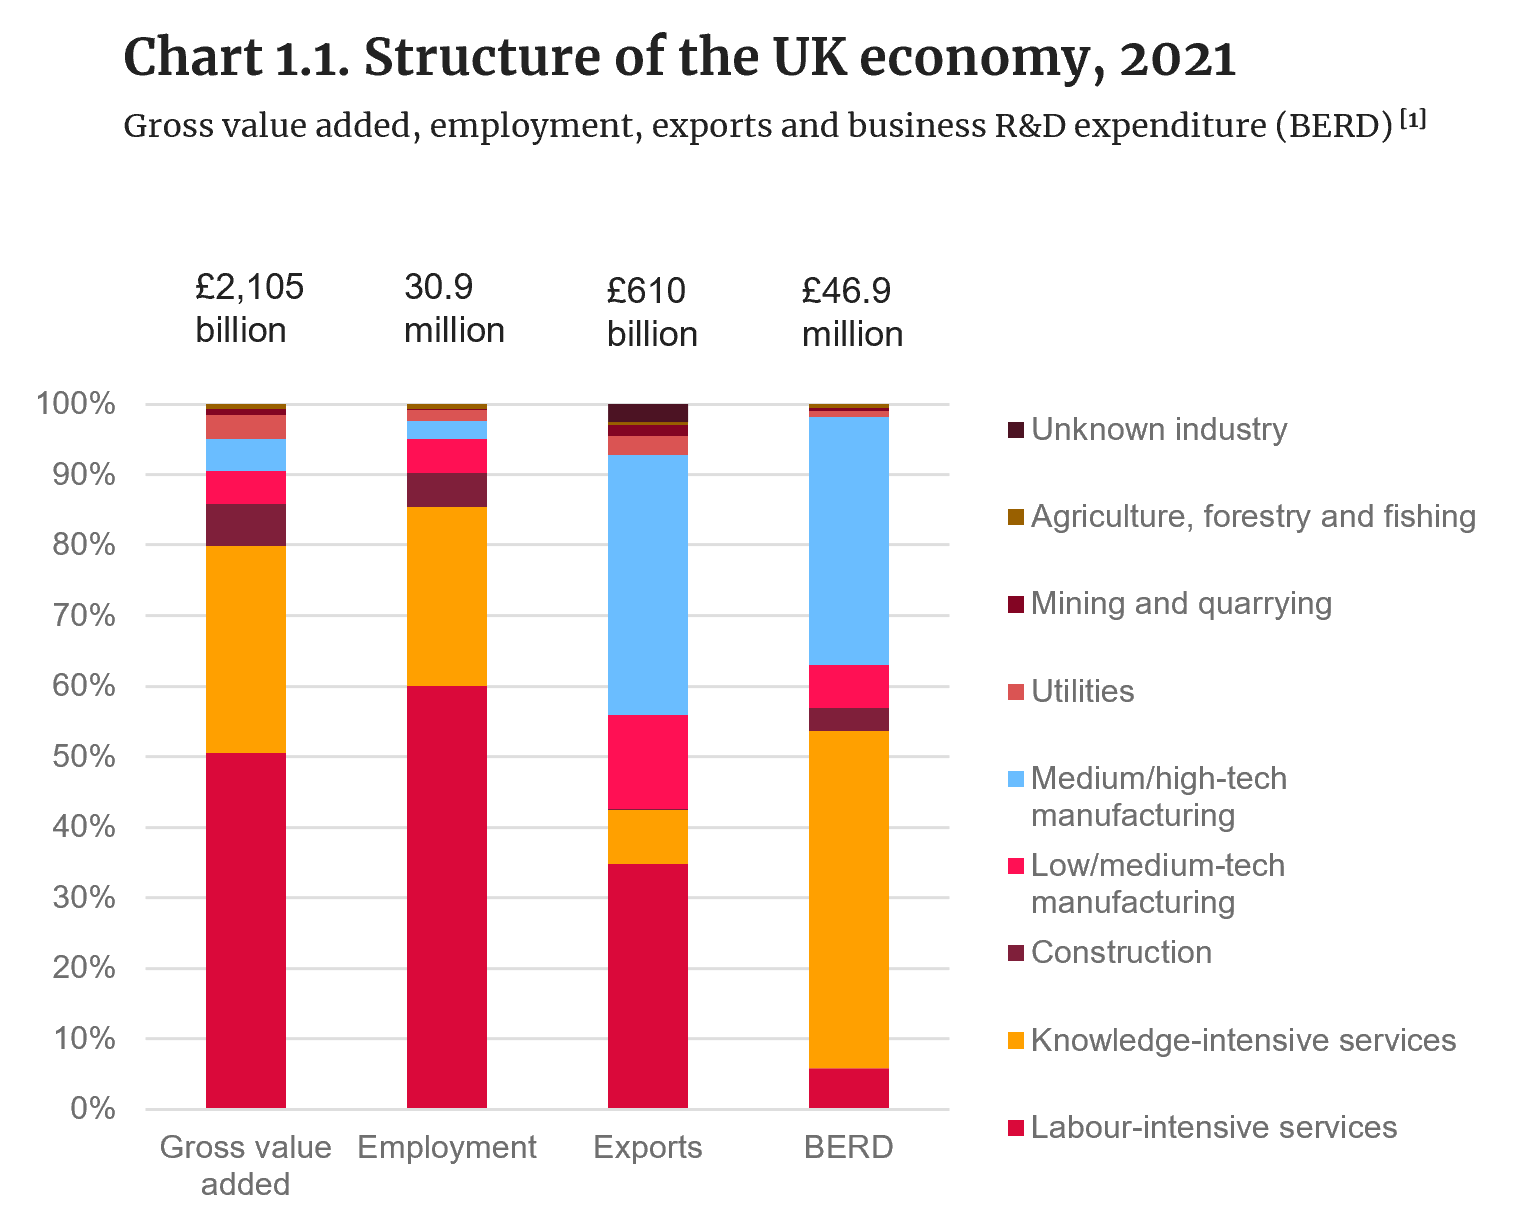
Source: Office for National Statistics.
- Both knowledge-intensive[1] and labour-intensive services [1] represented around 80% of the gross value added and employment of the UK economy in 2021.
- Although medium/high-tech manufacturing [1] accounts for 5% of the gross value added and 3% of employment, this sector accounts for the largest share of exports: 37% in 2020 and the second largest share of business R&D expenditure, around 35%, in 2021.
- The manufacturing sector as a whole accounts for less than 10% of the UK’s value added. However, the size of the manufacturing sector varies across UK regions and countries.
Labour productivity by country and region
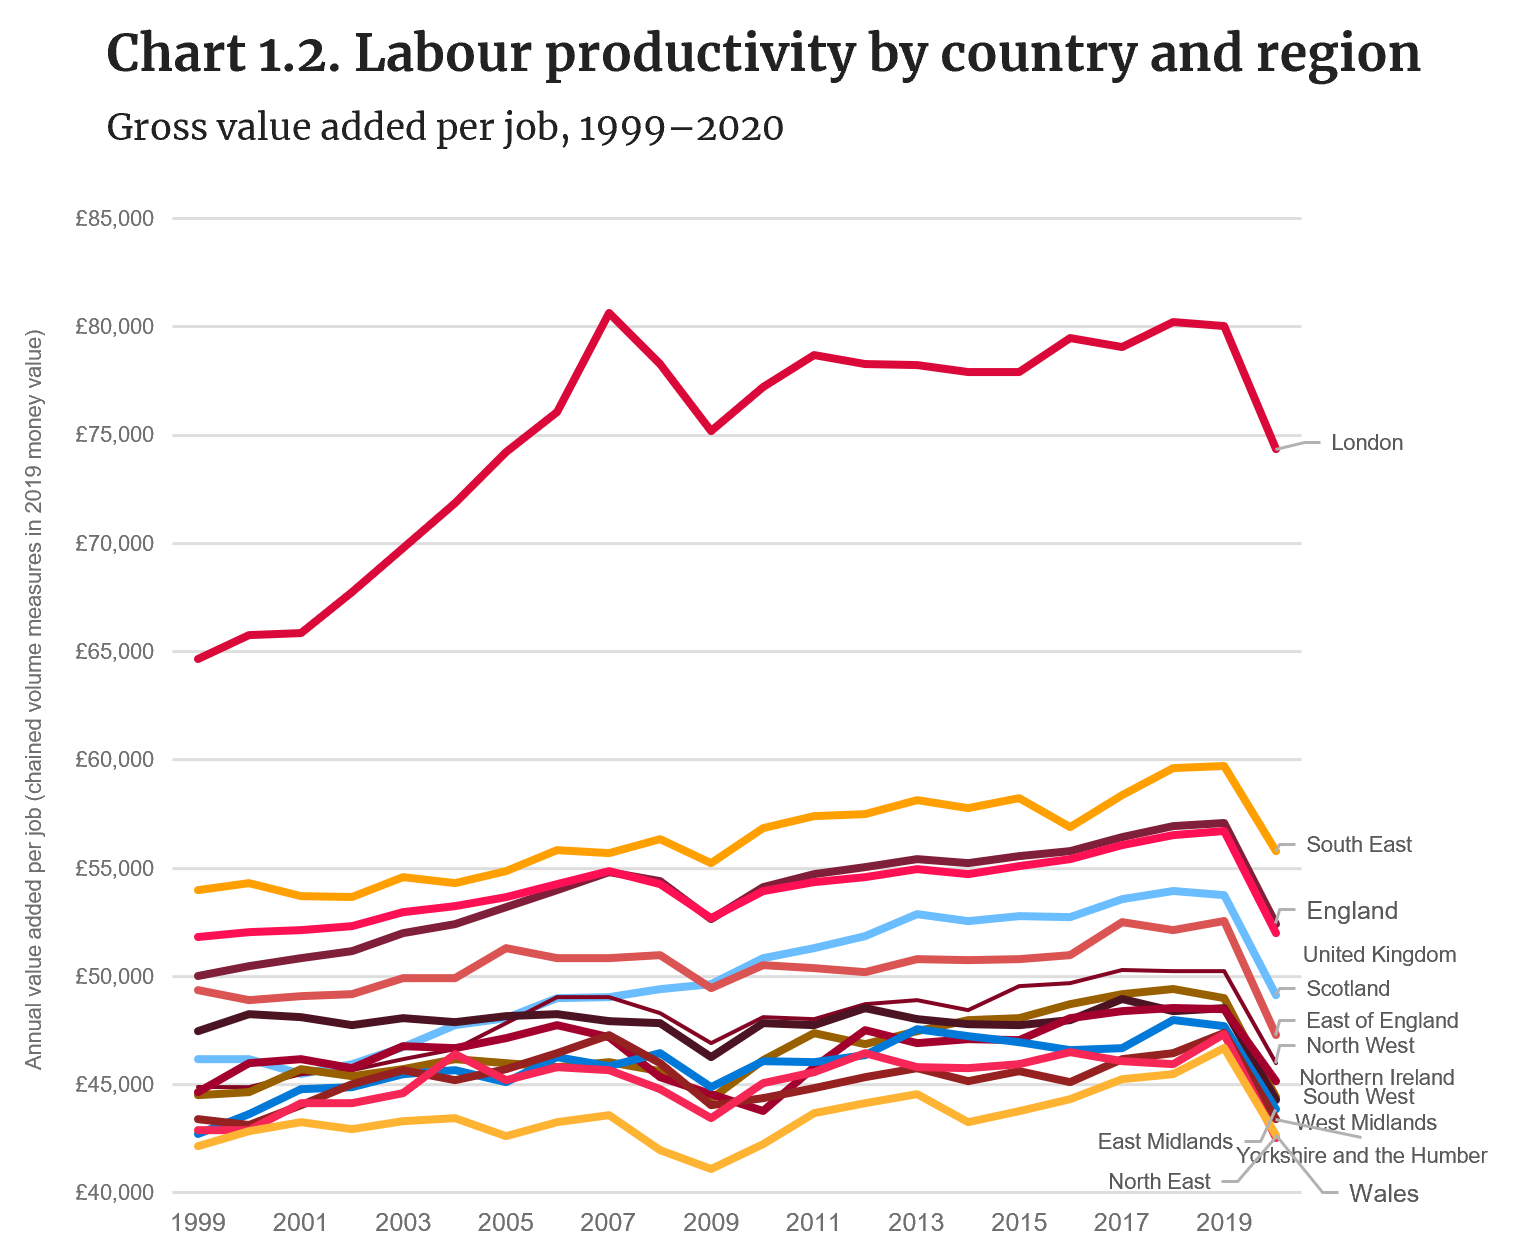
Source: Authors’ calculations, based on data from the Office for National Statistics.
- Substantial productivity gaps are observed between UK regions and countries. In 2019 London and the South East of England were the UK regions with the highest labour productivity levels, with annual values of £80,034 and £59,709 per job. In contrast, Wales, the North East of England, and Yorkshire and the Humber had the lowest productivity levels, at around £47,000.
- Productivity gaps have widened in the last two decades. In 1999 labour productivity in Wales represented 65% of that observed in London; however, in 2019 productivity in Wales accounted for only 58% of that of London.
- Between 1999 and 2019 London and Scotland were the regions and countries that experienced the fastest productivity growth, with rates of 1% and 0.8%, respectively.
- Scotland also fared better during the financial crisis of 2008/9; it did not experience a fall in productivity levels in this period like the rest of the UK did.
- A reduction in productivity levels was observed across the board in 2020, as a result of the COVID-19 pandemic and related impacts.
Sectoral labour productivity by country and region
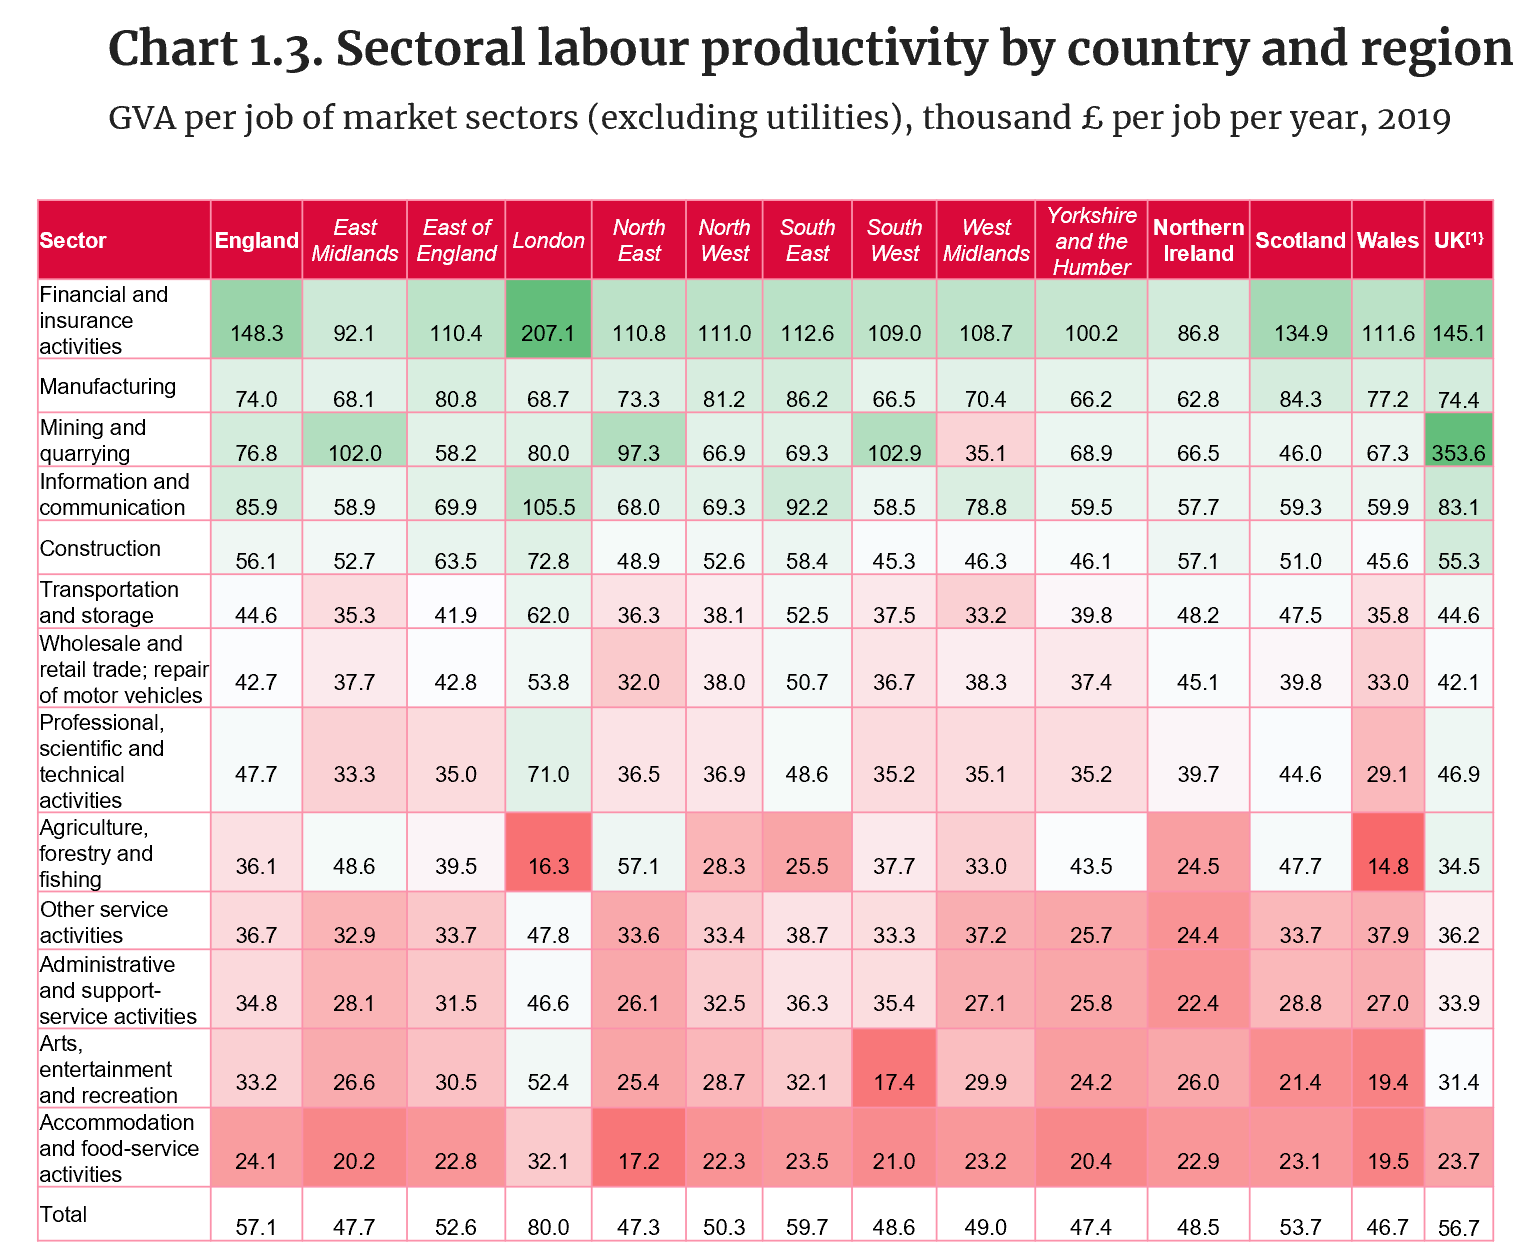
Note: [1] UK values include extraterritorial activities not assigned to a specific region.
Source: Authors’ calculations, based on data from the Office for National Statistics.
- Chart 1.3 presents labour productivity levels across the UK regions and countries of sectors where transactions occur predominantly in the market, excluding electricity, gas and water supply.
- Across the UK regions and countries, financial and insurance activities, information and communication, manufacturing and construction have among the highest productivity levels.
- In comparison, labour-intensive services, such as accommodation and food-service activities, entertainment and recreation, and administrative and support-service activities, tend to have some of the lowest productivity levels.
- Spatial disparities are particularly large in agriculture, forestry and fishing (38% of the UK value); arts, entertainment and recreation (28% of the UK value); professional, scientific and technical activities (23% of the UK value); and financial and insurance activities (21% of the UK value).[1]
- London stands out for productivity levels above the UK average with between 27% (information and communication) and 67% (arts, entertainment and recreation) across most sectors, with the exception of manufacturing and agriculture, which have productivity levels below the UK average.
- The productivity of London’s professional, scientific and technical activities is 2.4 times larger than that observed in Wales, the UK area with the lowest productivity level in this sector.
- The North East of England has the highest productivity levels in agriculture, forestry and fishing, 2.3 times larger than those in Northern Ireland. Meanwhile, the South East of England and Scotland have the highest productivity levels in manufacturing, more than 30% higher than those observed in Northern Ireland.
Sectoral labour productivity growth by country and region
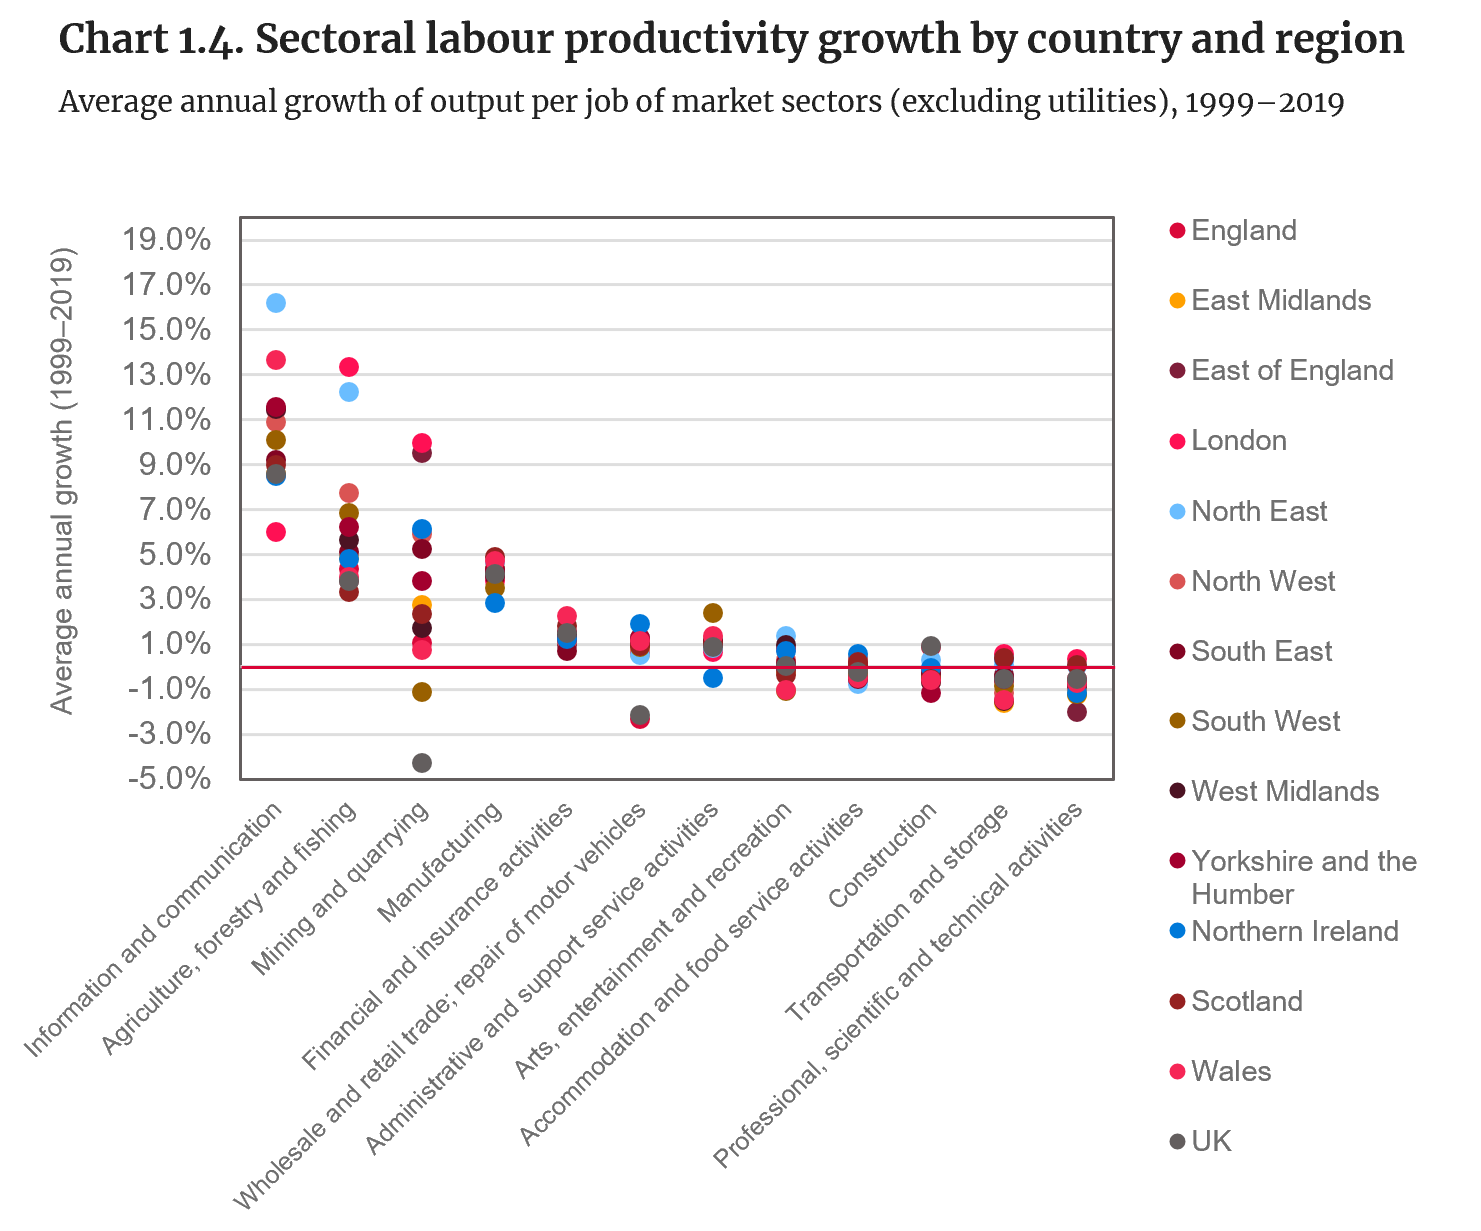
Source: Authors, based on data from the Office for National Statistics.
- Among market sectors, and excluding electricity, gas and water supply, information and communication, agriculture, mining and quarrying, and manufacturing tend to show faster labour productivity growth, while construction, transportation and storage, and professional, scientific and technical activities show weaker and even negative growth rates.
- Differences are observed across UK countries and regions, particularly in the pace of productivity growth in information and communication, agriculture, and mining and quarrying. However, the contribution of the latter is negligible across most of the UK regions and countries, since most mining activities are assigned to specific regions in official statistics.
- Between 1999 and 2019 the UK areas that saw the fastest productivity growth rates of the information and communication sector include the North East of England (16.2%) and Wales (13.6%). In contrast, London saw the slowest growth (6.0%).
- During the same period, the fastest labour productivity growth in agriculture was observed in London (13.3%) and the North East (12.2%). However, as presented in Chart 1.3, London’s labour productivity in agriculture was the lowest across regions. In comparison, Scotland had the most modest growth (3.3%).
[1] Teneyro, S. (2018). The fall in productivity growth: causes and implications.
[2] Riley et al. (2018). Below aggregate: a sectoral account of the UK productivity puzzle.
Value-added and employment shares by sector, country and region, 2019
Source: Office for National Statistics. Regional gross value added (balanced) by industry.
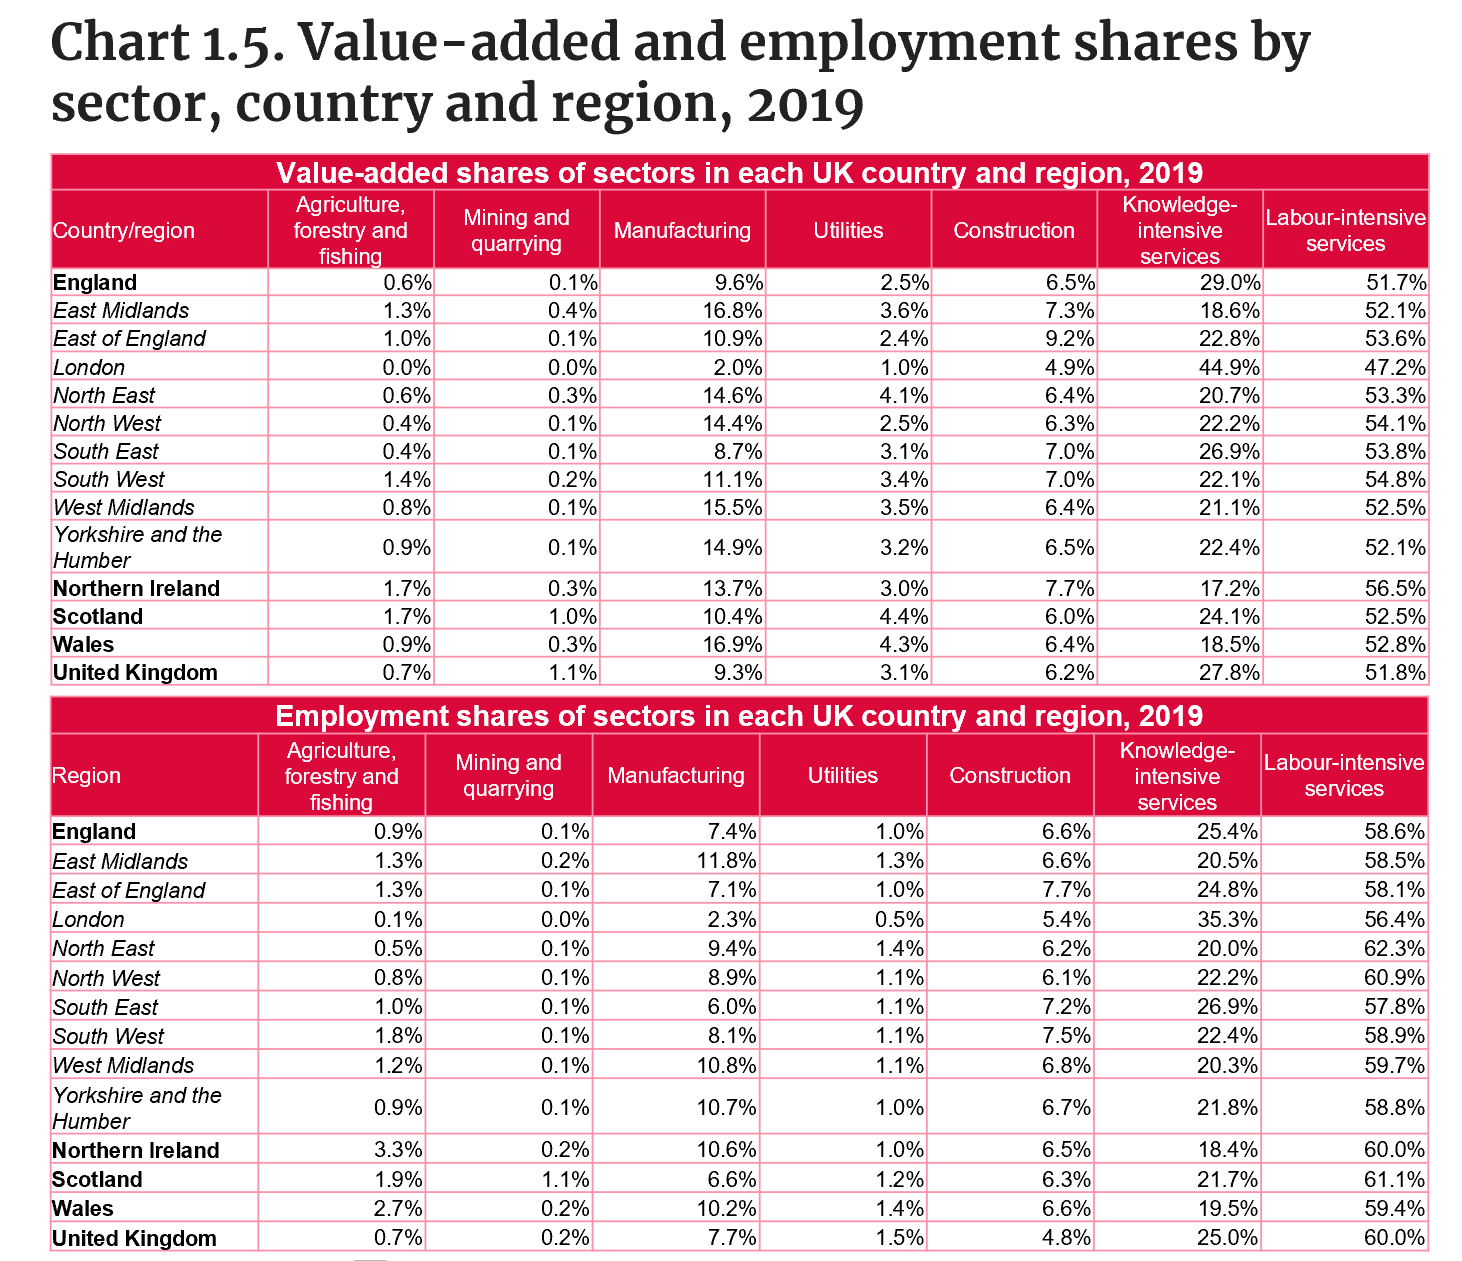
- Across countries and regions, labour-intensive services[1] account for around half of the total UK value added and employment. This category groups together activities such as accommodation and food services, entertainment and recreation, and administrative and support-service activities, which, as shown in Charts 1.3 and 1.4, tend to have among the lowest productivity levels and slower productivity growth.
- In 2019 Northern Ireland saw the largest share of value added (56.5%) of these activities, while London saw the smallest share (47.2%). In terms of employment, the largest shares of these services are seen in the North East of England (62.3%) and Scotland (61.1%).
- Knowledge-intensive services[1] account for around a quarter of the value added and employment of the total economy across regions and countries. Larger financial, and professional and scientific sectors, in comparison with other UK areas, mean that London has the largest share of these activities (44.9% value added and 35.3% employment). In comparison, Northern Ireland, Wales and the East Midlands have particularly low shares of these activities.
- Manufacturing is the third largest contributor to UK value added and employment among the economic activity groups examined. In terms of value added, it is particularly important in Wales (16.9%), the East Midlands (16.8%), and the West Midlands (15.5%); meanwhile, in terms of employment, the largest shares are seen in the East (11.8%) and West Midlands (10.8%), and in Yorkshire and the Humber (10.7%). In comparison, London has the lowest shares of manufacturing in the UK (2.0% value added and 2.3% employment).
Change in value-added and employment shares by sector, country and region, 1999–2019
Source: Office for National Statistics. JOBS05 Workforce jobs by region and industry.
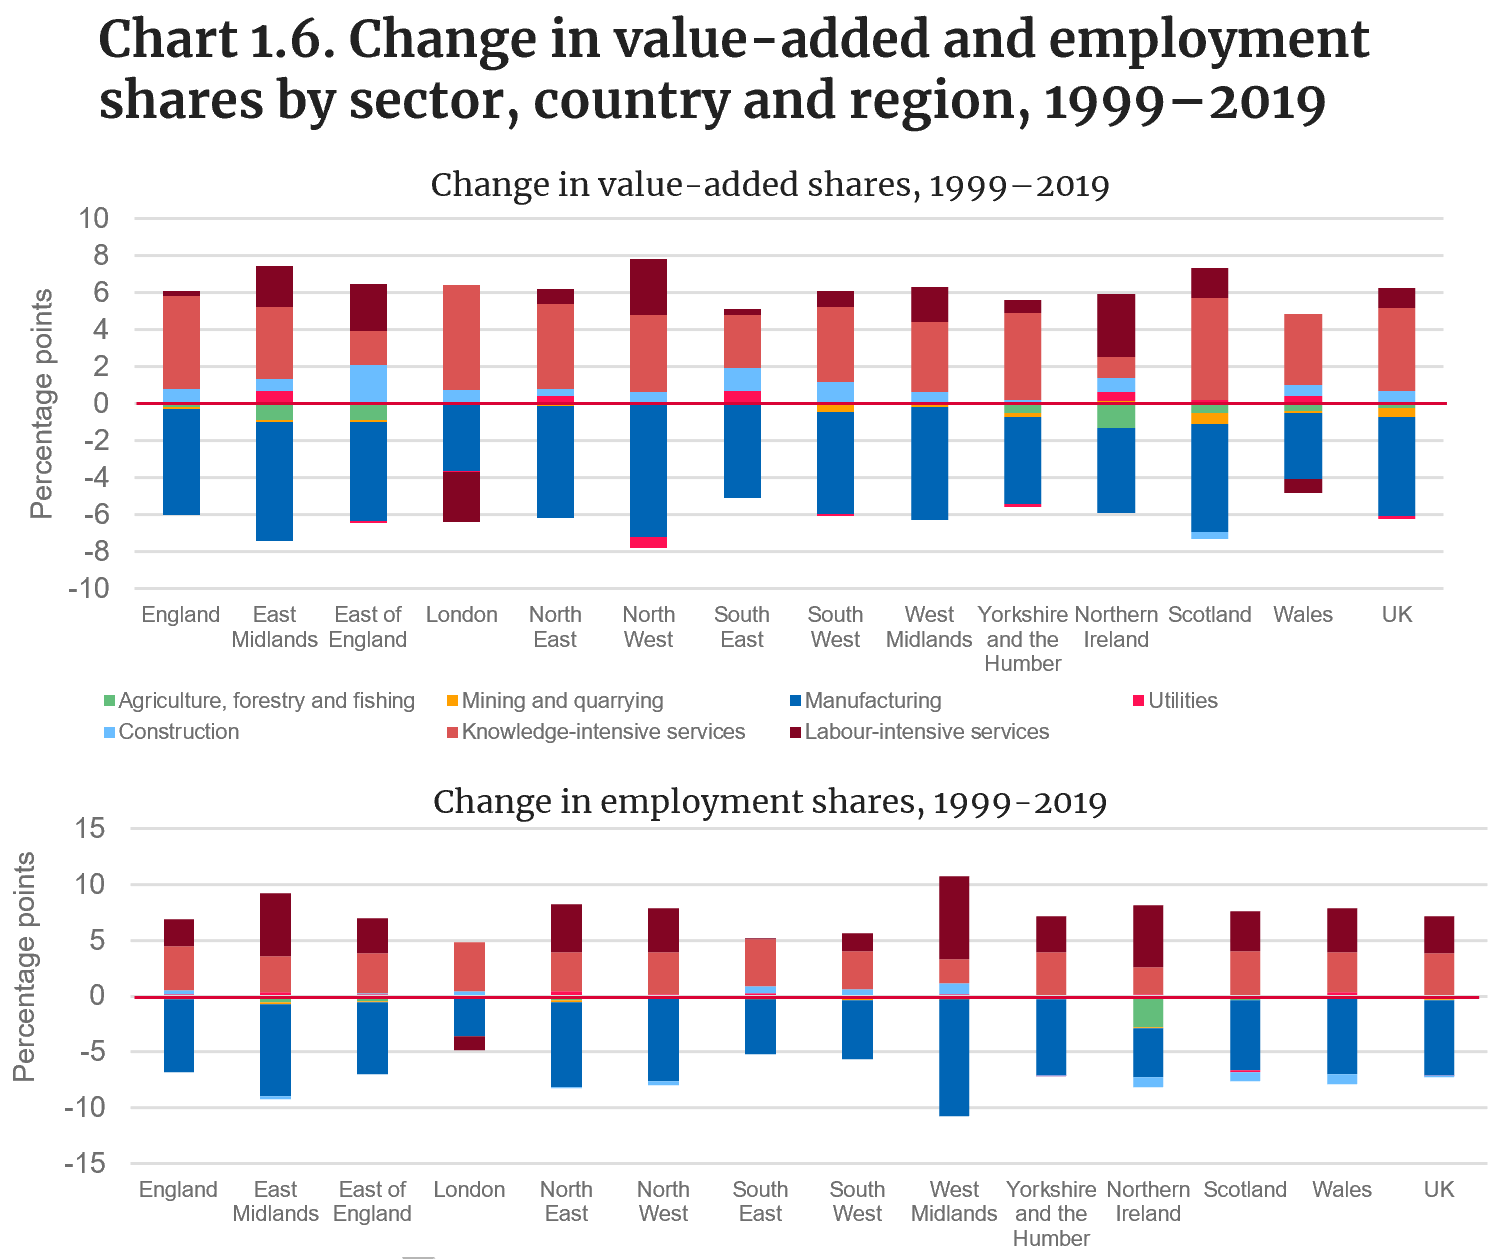
- As highlighted in the 2022 edition of the UK Innovation Report, a key change observed in the structure of the UK economy in recent decades is the decline in the participation of manufacturing and the consequent increase in the size of service activities.
- The regions that saw the greatest decline in manufacturing activities between 1999 and 2019 include: the North West of England (-7.2 pp. in value added and -7.5 pp. in employment); the East Midlands (-6.4 pp. in value added and -8.2 pp. in employment); and the West Midlands (-6.1 pp. in value added and -10.5 pp. in employment).
- Knowledge-intensive services [1] experienced a substantial expansion between 1999 and 2019, particularly in London (5.6 pp. in value added and 4.4 pp. in employment) and Scotland (5.5 pp. in value added and 4.0 pp. in employment). This expansion was mainly driven by the growth of professional, scientific and technical activities.
- The second largest expansion across sectors is observed in labour-intensive services[1] and explained by the growth of human health and social work activities and administrative and support-service activities. This trend is especially pronounced in Northern Ireland in terms of value added (3.4 pp.) and in the West Midlands in terms of employment (7.4 pp.).
- In comparison, the shrinkage of wholesale and retail trade in London has meant the largest decline in the contribution of these activities (-2.7 pp. value added and -1.2 pp. employment).
- Northern Ireland experienced the fastest decline in the participation of agriculture in the regional economy (-1.3 pp. in terms of value added and -2.8 pp. in employment shares).
Intra-industry productivity growth effect: top and bottom five sectors in the UK
Source: Authors’ calculations, based on data from the Office for National Statistics.
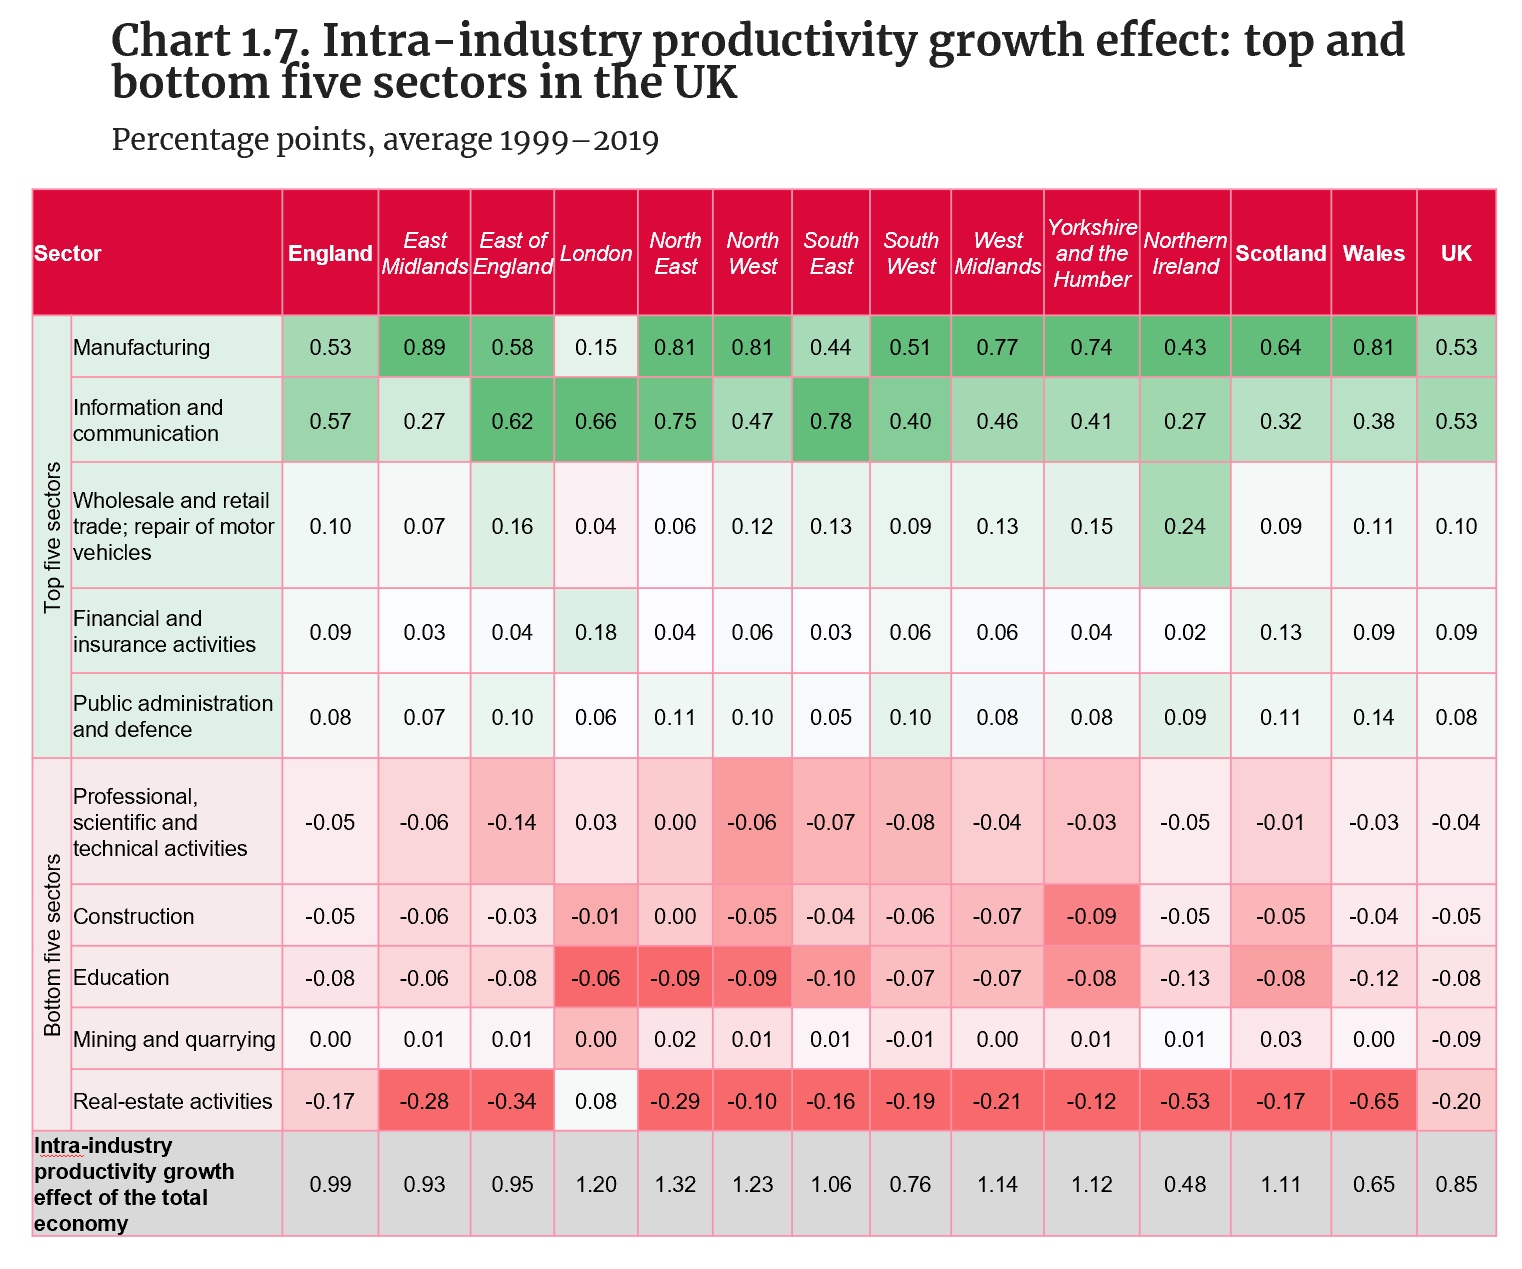
- Chart 1.7 shows the top and bottom five sectors by their contributions to labour productivity growth in the UK via the intra-industry productivity growth effect. The intra-industry productivity growth effect measures how fast the productivity of a sector grows weighted by its value-added share (see Appendix 1.2).
- Between 1999 and 2019 the North East, North West and London regions stood out for having the largest intra-industry productivity growth effects in the UK.
- Across countries and regions, manufacturing and information and communication account for the largest contributions to productivity growth via intra-industry growth effect.
- In relative terms, that is, as a percentage of the intra-industry growth effect of the total economy, the largest contributions to aggregate productivity growth from manufacturing are observed in Wales (124.7%) and the East Midlands (95.8%).
- In the case of information and communication, the largest contributions via intra-industry productivity growth effect are observed in the South East of England (73%) and the North East (56.9%).
- In some countries and regions, such as Northern Ireland (0.12 pp., 24.8% in relative terms), the South West of England (0.08 pp., 10.8% in relative terms) and the East Midlands (0.09 pp., 10.2% in relative terms), agriculture – a sector that has shown fast productivity growth in recent decades (Chart 1.4) – also appears among the top five sectors based on its intra-industry productivity growth effect.
- In comparison, with the exception of London, where they account for 0.08 pp., real-estate activities have made negative contributions to labour productivity growth across the UK. Caution is needed, however, when analysing this sector, since imputed rents from owner-occupied dwellings are included in the value added.
Allocation effect: top and bottom five sectors in the UK
Source: Authors’ calculations, based on data from the Office for National Statistics.
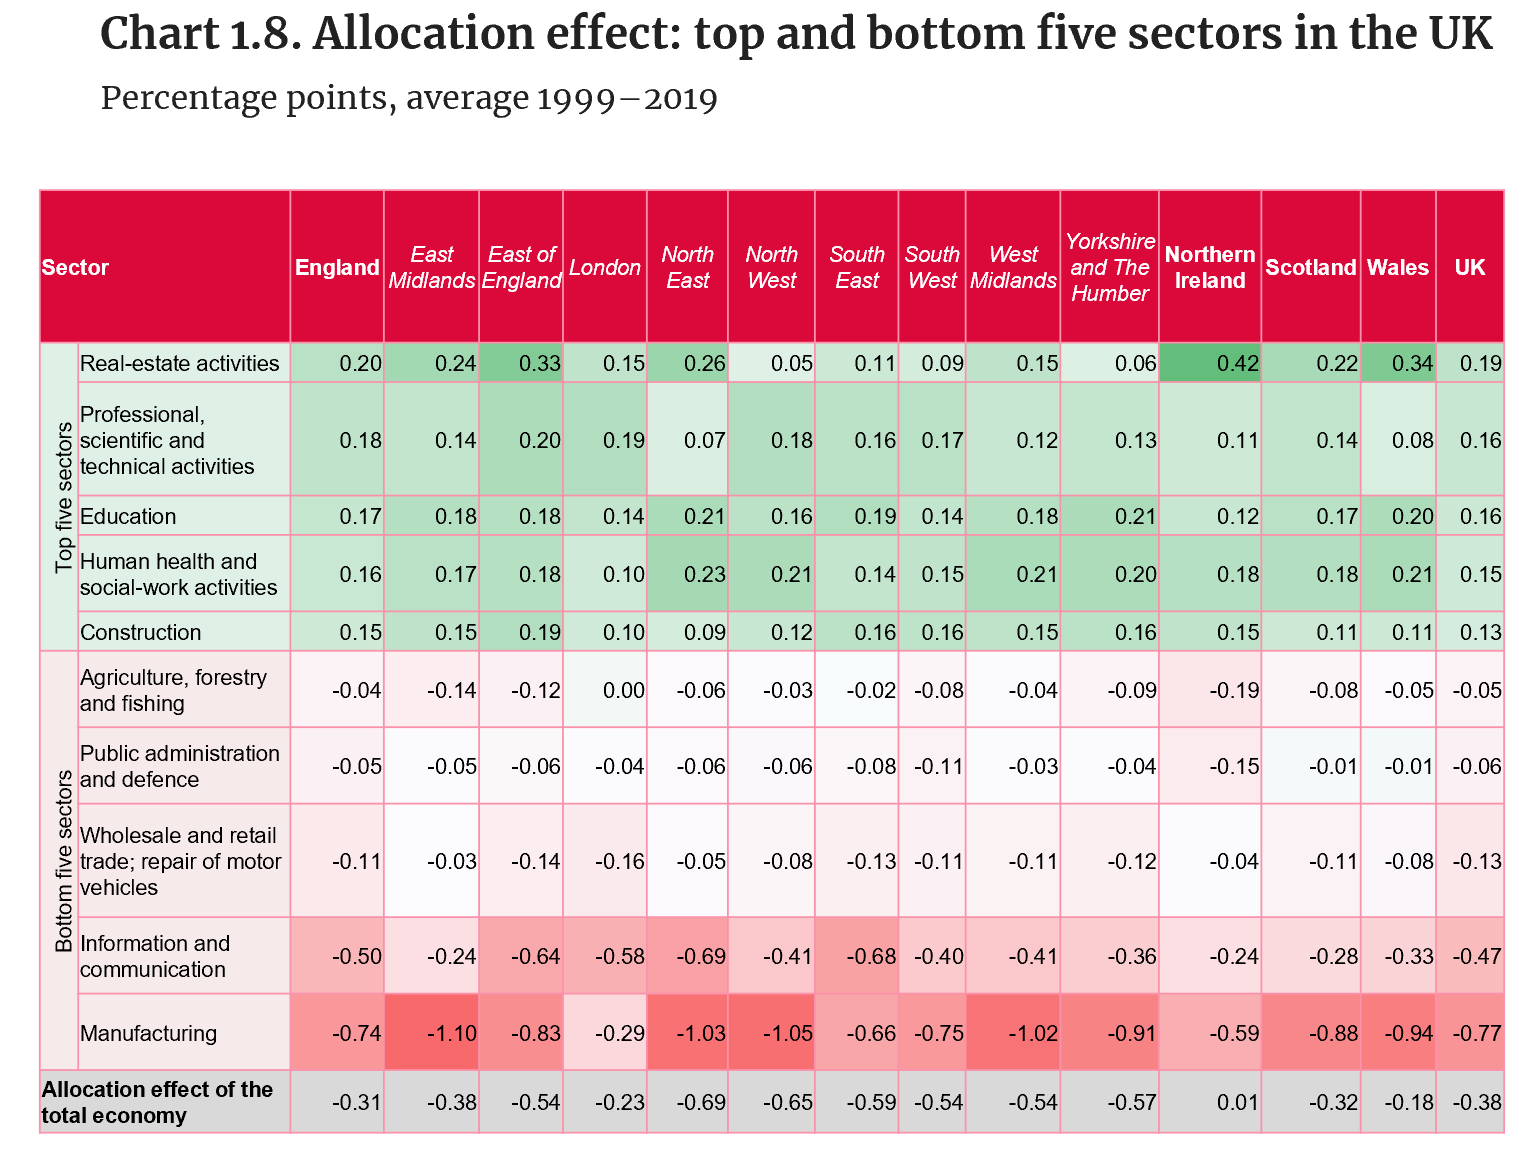
- Chart 1.8 shows the top and bottom five sectors by their relative contributions to labour productivity growth in the UK via the allocation effect. The allocation effect measures how the expansion or reduction of sectors contributes to productivity growth. Sectors with higher productivity levels receive higher weights in this measure (see Appendix 1.2).
- Between 1999 and 2019, except for Northern Ireland, all of the UK countries and regions experienced negative allocation effects. In other words, shifts in the size of sectors had a negative net effect on overall labour productivity growth. The decline in the size of manufacturing (employment) and information and communication (relative prices) account for most of this negative effect.
- The most negative impacts from the shrinkage of manufacturing between 1999 and 2019 are observed in the East Midlands, the North West, the North East and the West Midlands, where the decline of manufacturing cost these regions a percentage point, on average per year, between 1999 and 2019.
- Other sectors that have shrunk in the last 2 decades, and thus reduced their contributions to overall labour productivity growth, include: wholesale and retail, particularly in London (-0.16 pp.), public administration and defence, and agriculture, particularly in Northern Ireland (-0.15 pp. and -0.19 pp.).
- In comparison, sectors such as real estate, professional, scientific and technical activities, education, human health and construction saw their contributions to aggregate productivity growth increase from 1999 to 2019. However, as these sectors tend to show productivity levels below the average, their expansion has not compensated for the contraction of manufacturing and information and communication and thus the negative total allocation effect.
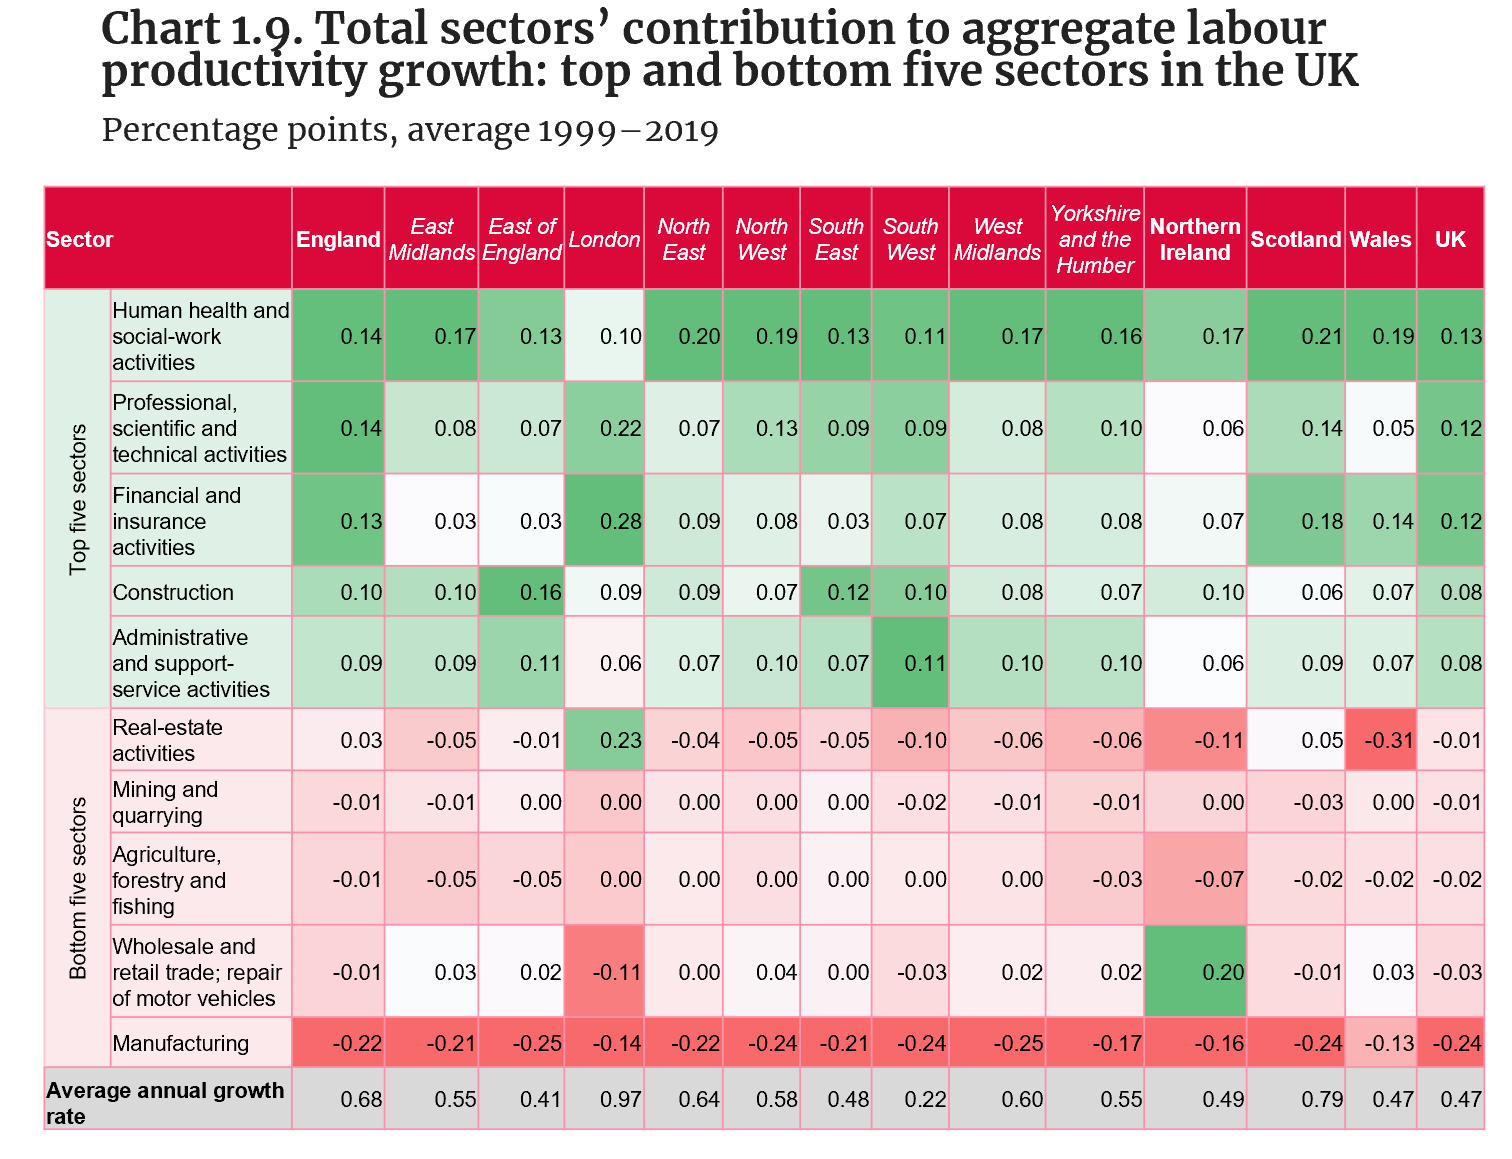
Total sectors’ contribution to aggregate labour productivity growth: top and bottom five sectors in the UK
Source: Authors’ calculations, based on data from the Office for National Statistics.
- Chart 1.9 shows the top and bottom five sectors by their total contributions to aggregate labour productivity growth in the UK. This is the sum of the intra-industry productivity growth effect (Chart 1.7) and the allocation effect (Chart 1.8) (see Appendix 1.2).
- Between 1999 and 2019 sectors such as human health and social-work activities, professional, scientific and technical activities, and administrative and support-service activities, with slower productivity growth (Chart 1.4) and productivity levels below the average of the total economy (Chart 1.3), were among the top five sectors contributing to productivity growth. The largest relative contributions of these sectors are observed in the South West of England, the region with the slowest labour productivity growth in the UK between 1999 and 2019.
- Because of its reduction in size, manufacturing has contributed negatively to aggregate productivity growth, despite having relatively high productivity levels (Chart 1.3) and experiencing fast productivity growth (Chart 1.4). The most negative contributions (relative to the productivity growth of the total economy) are observed in the South West of England (-108.7%) and the East of England (-61.4%). This means that, in the case of the South West, if manufacturing had not declined, labour productivity in this region would have grown more than twice as fast.


