
Theme 3b
Food and Beverages Sector
The Food and Beverage Manufacturing Sector
The Food and Beverage Manufacturing Sector
Key UK food and beverages manufacturing trends in the last decade
- The value added of the UK food and beverages sector has increased during the last decade, while its productivity has remained roughly stable. The UK ranked sixth among OECD member countries for food and beverages manufacturing in 2019 by value added.
- The UK has one of the largest food trade deficits among comparator countries, while it remains a leading exporter of beverages. The UK occupied the lower part of the global food trade balance ranking in 2021, with a total deficit in food trade balance of US$24.6 billion in 2021. In contrast, the UK ranked ninth in the global beverages trade balance ranking in 2021, with a surplus of US$1.25 billion.
- UK business expenditure on food and beverages R&D has increased steadily during the last decade, comparable to other leading OECD nations. R&D expenditure by UK food and beverages firms was 36% higher in 2019 than in 2008, compared to increases of 283% in China and 142% in Korea, whereas the Netherlands recorded growth below UK levels.
Drivers identified in literature review and sector expert consultations
Value added and productivity
- The demand for food and beverages is inherently resilient to recession and external events.
- Alcoholic beverages and other food products have been key to sector growth.
- Ready-meals market growth correlates positively to post-2008 financial crisis recovery.
- The long-term sustainability of the sector depends on its ability to tackle concerns such as inflation and rising energy costs, sterling depreciation, labour shortages, and threats such as climate change.
Trade
- The sector’s domestic orientation contributes to resilience and food security, while it diminishes the appetite for export markets.
Food and drink exports reflect niche strengths in high-value segments for the UK.
- Imports are a necessary and inevitable part of the UK food and beverages sector.
R&D and innovation
- Innovation is a key focus for the UK food and drink industry, with R&D investments driven by the need to create a more resilient and nutritious food supply.
- Emerging regulations and high-level policy targets have partly shaped the direction of innovation efforts (e.g. the sugar tax, sustainability and net-zero targets, plastic packaging tax and related initiatives, food-waste targets).
- Automation and digitalisation are seen as key to increasing sectoral productivity. However, economic uncertainty may diminish business confidence and investment in these solutions.
Food and beverages manufacturing – value added and employees
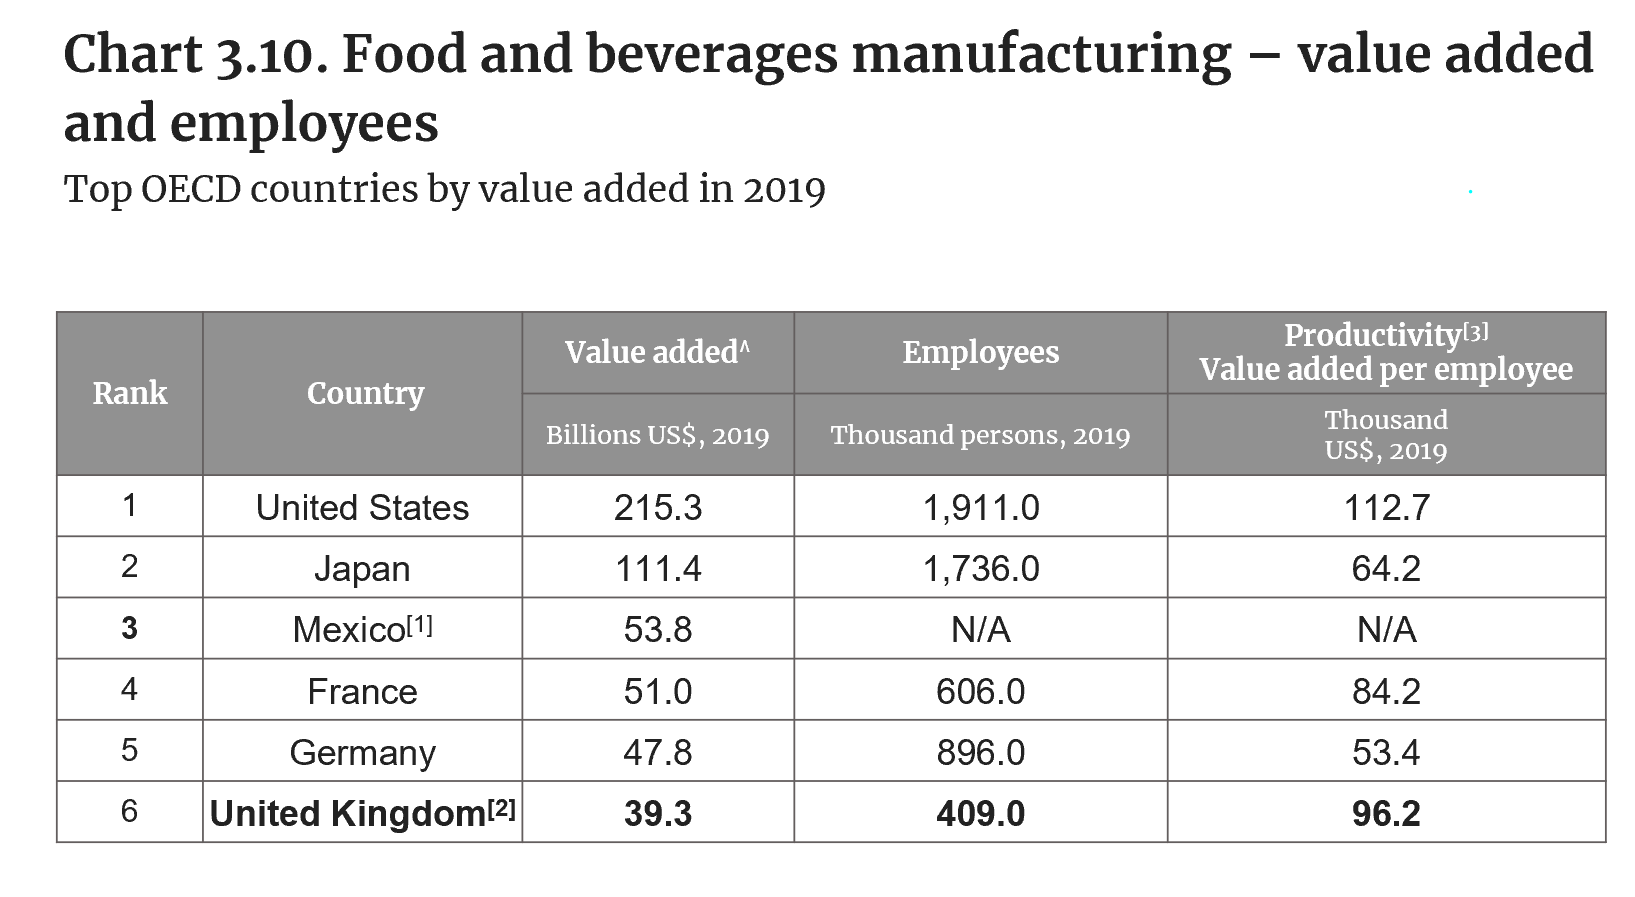
Note: [1] Mexico value-added data for 2018, and Mexico employee data is unavailable. [2] United Kingdom employee data for 2018. [3] OECD provides the value added for each country in its national currency; these value added were converted into USD by referring to annual exchange rates provided by OECD.
Source: OECD STAN, ISIC4, D10T11: food products and beverages; OECD, MEI, exchange rates (USD monthly averages). Accessed February 2023.
- The UK ranked sixth among OECD member countries for food and beverages manufacturing in 2019 by value added in US$. This is nearly three times lower than the value added reported by Japan and more than five times lower than the United States, which leads the ranking.
- The UK’s food and beverages manufacturing sector had the lowest number of employees among the top-performing countries, with 409,000 employees in 2019.
- The UK’s productivity (i.e. value added per employee) in food and beverages manufacturing was the second highest among top OECD performers, at US$96,200 per employee in 2019, below the US$112,700 per employee reported by the United States.
UK food and beverages manufacturing – value added
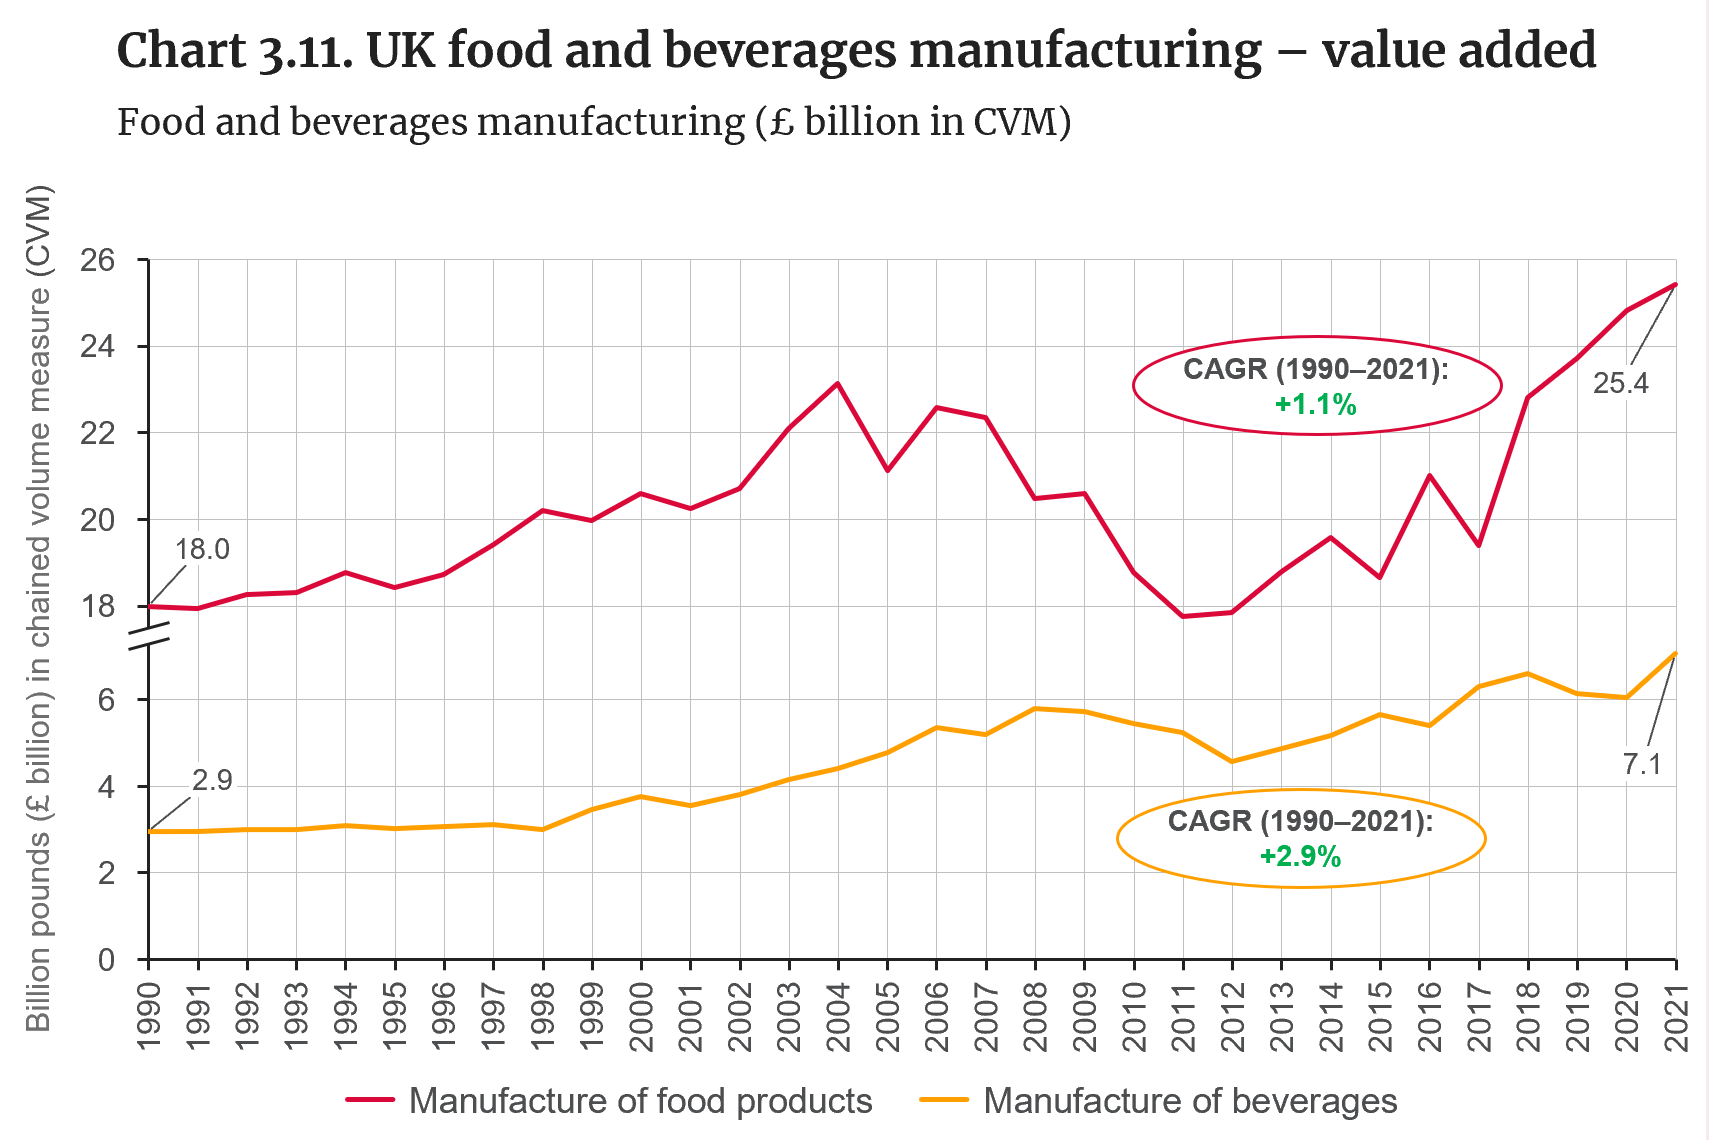
Source: ONS, GDP output approach – low-level aggregates (updated version: 22 December 2022); manufacture of food products (SIC 2007 Code 10), manufacture of beverages (SIC 2007 Code 11).
- According to ONS data, both the manufacture of food products and the manufacture of beverages have increased their overall value added since 2012 in the UK, after experiencing drops in value added between 2008 and 2012. Both sub-sectors reached their historical high points in 2021 (1990–2021 period of analysis).
- Value added for food manufacturing was £25.4 billion in 2021, with a compound annual growth rate (CAGR) of 1.1% between 1990 and 2021.
- Value added for beverages manufacturing was £7.1 billion in 2021, with a compound annual growth rate (CAGR) of 2.9% during the same time period.
- Sector resilience was demonstrated during the 2008 financial crisis, when the production index for food and drink fell by 1.9 between May 2008 and May 2009, compared to 13.1 for manufacturing overall [IfM, 2010].
- Similarly, UK household and eating-out expenditure on food and drink increased between 2001 and 2020 (including during the 2008 financial crisis) [DEFRA, 2022; DEFRA, 2023].
UK food and beverages manufacturing– employees
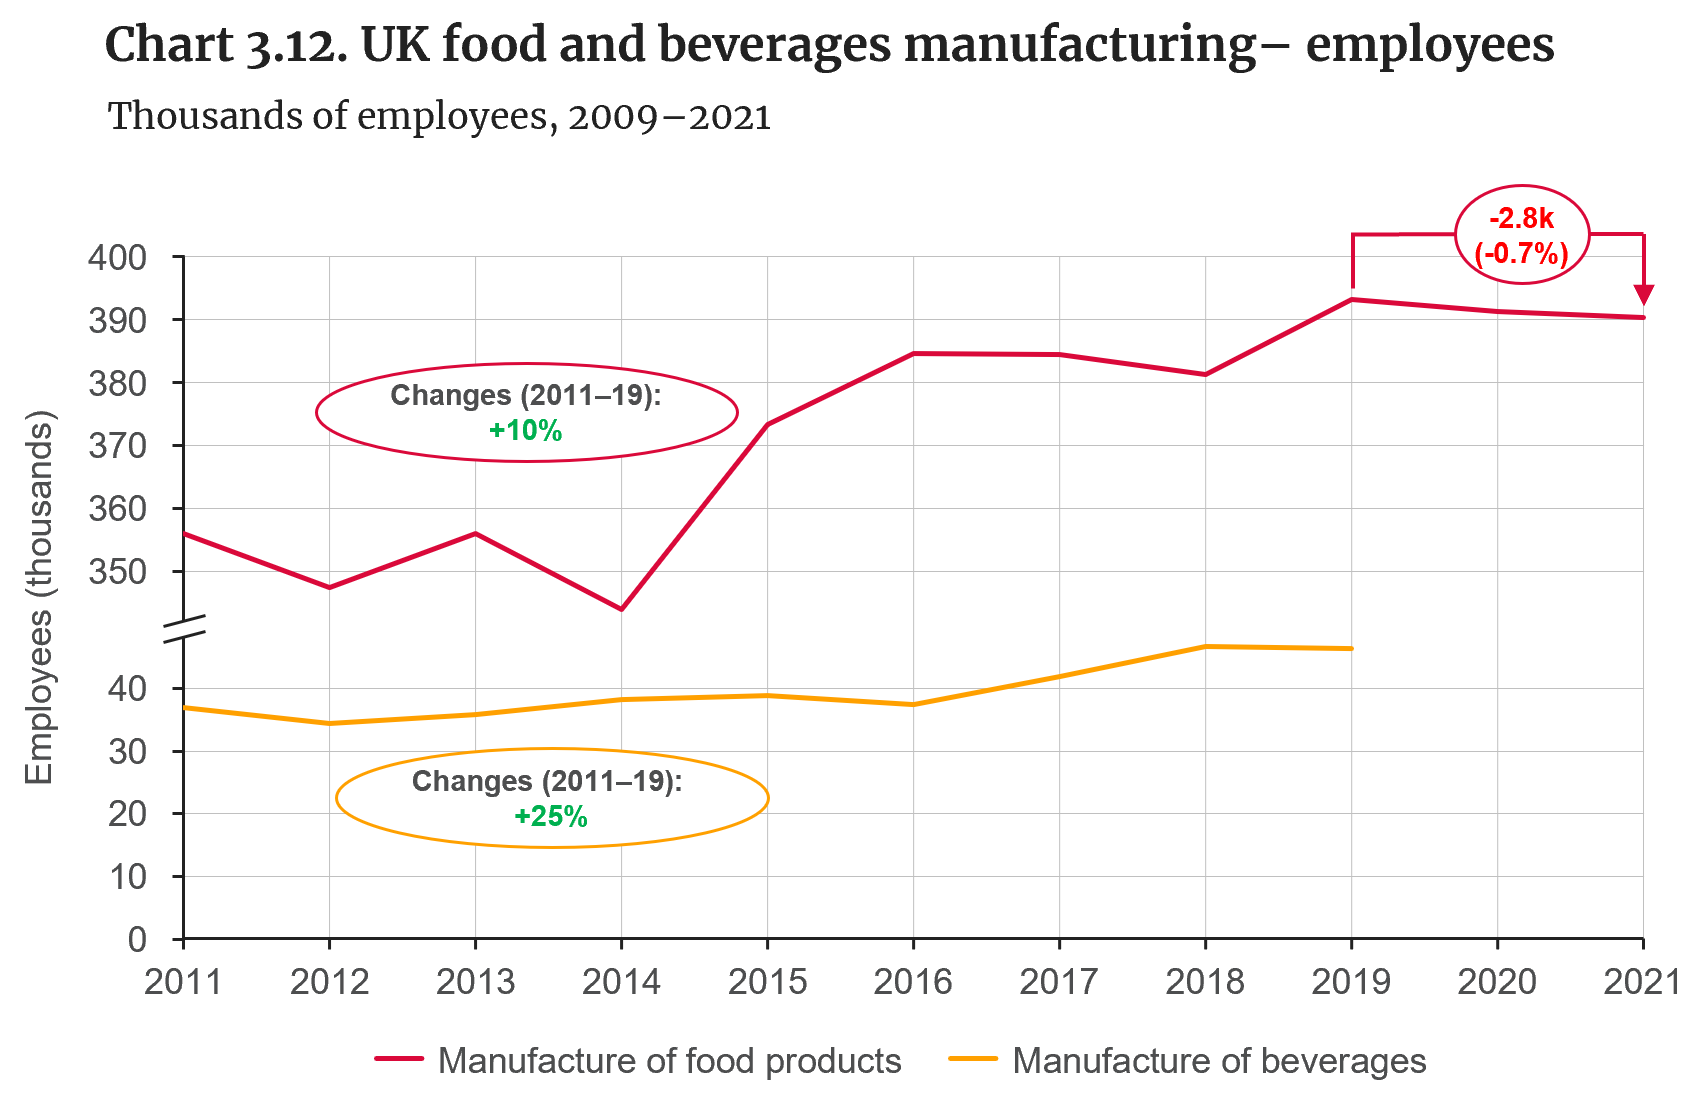
Source: ONS, Business Register and Employment Survey (BRES); manufacture of food products (SIC 2007 Code 10), manufacture of beverages (SIC 2007 Code 11).
- The number of employees involved in UK food manufacturing increased by 10% between 2011 and 2019, surpassing 390,000 employees.
- However, a drop of 2,800 employees was recorded for food manufacturing between 2019 and 2021.
- There was a surge in the number of employees observed in food manufacturing during 2014–15, with total employees increasing by 29,500 within one year.
- The number of employees involved in beverages manufacturing in the UK increased by 25% between 2011 and 2019, from 36,800 to 46,100.
- Consulted stakeholders agree that unfilled vacancies remain a significant issue for UK food and drink manufacturers. For example, an industrial survey by the Food and Drinks Federation found that the number of vacancies per 100 employees increased to 9.1 in Q3 2022, from 6.3 in Q2 2022, while 76% of respondents reported vacancy rates of 0–10% [FDF, 2022b].
UK food and beverages manufacturing – productivity
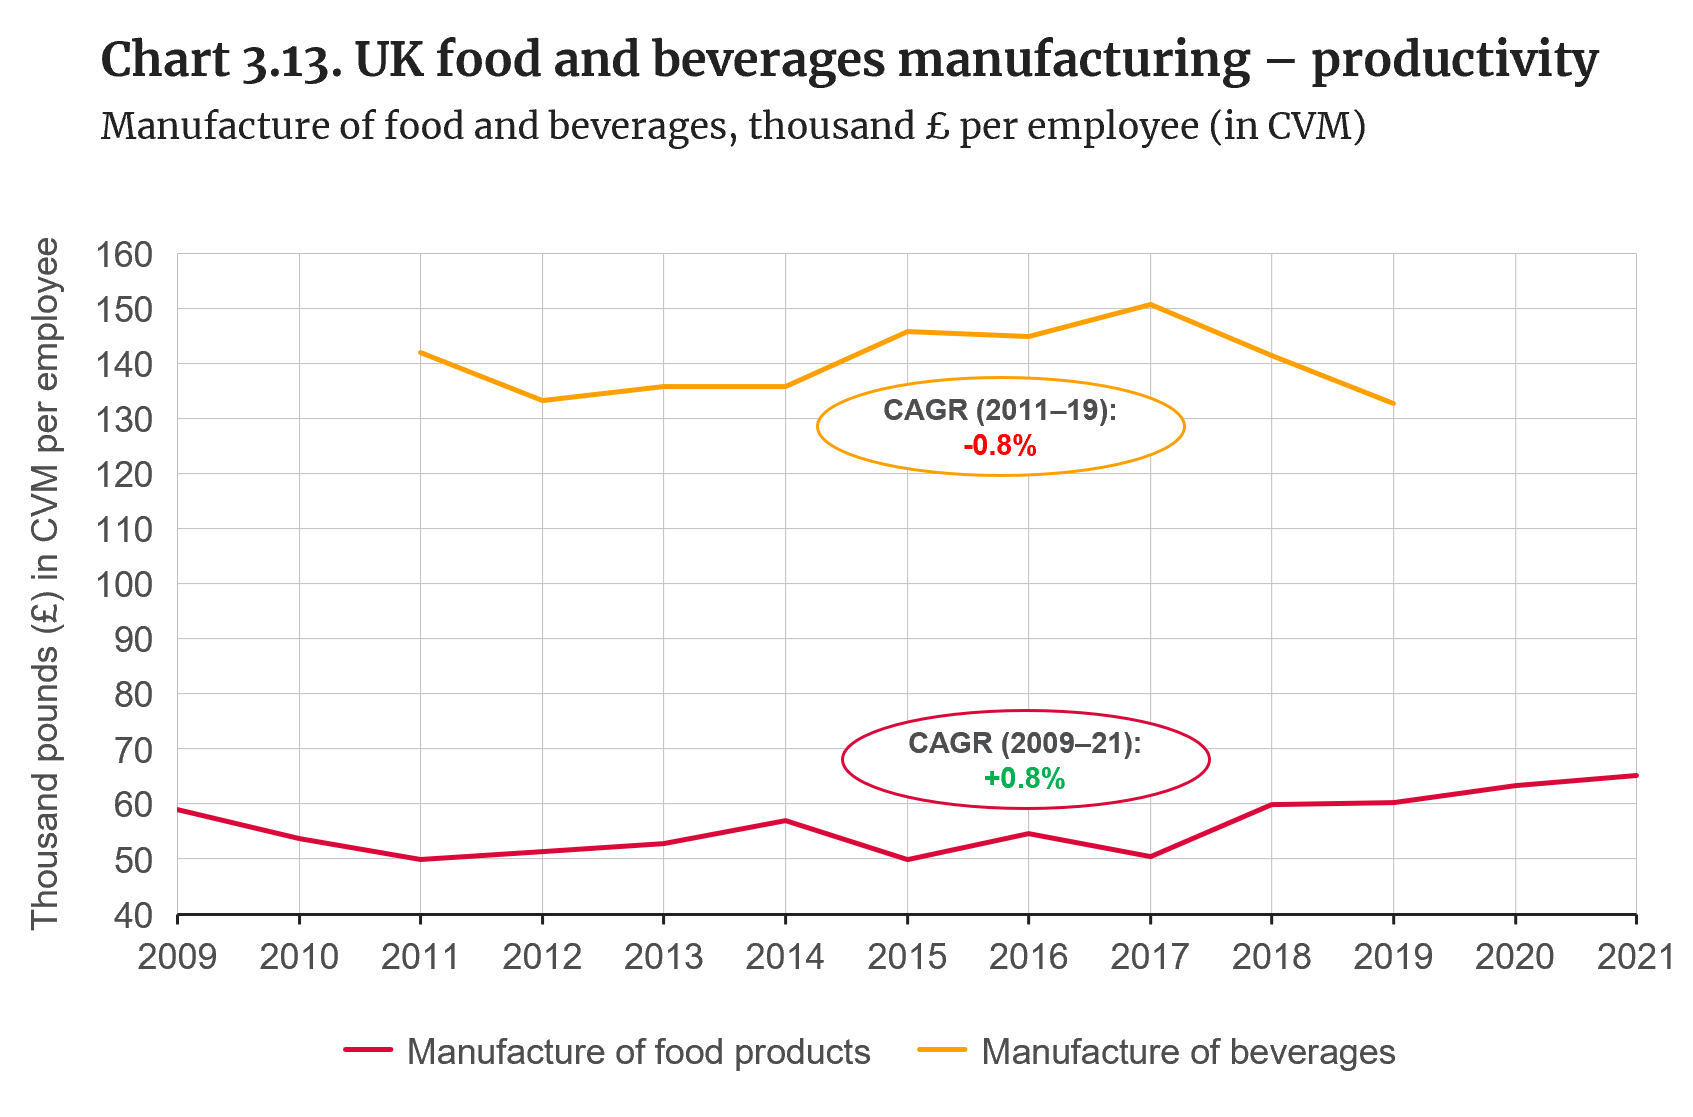
Source: ONS, GDP output approach – low-level aggregates (updated version: 22 December 2022); ONS, Business Register and Employment Survey (BRES); manufacture of food products (SIC 2007 Code 10), manufacture of beverages (SIC 2007 Code 11).
Based on the value added and number of employee trends observed in Charts 3.11 and 3.12, the following productivity trends (measured in thousand pounds per employee) can be observed:
- The productivity of the UK beverages manufacturing sector diminished between 2011 and 2019, presenting a compound annual growth rate of -0.8% during this period, from £150,791 per employee in 2017 to £132,733 per employee in 2019.
- The productivity of the UK food manufacturing sector increased slightly between 2009 and 2021, with a compound annual growth rate of 0.8%, totalling £65,100 per employee in 2021.
Food manufacturing –trade balance
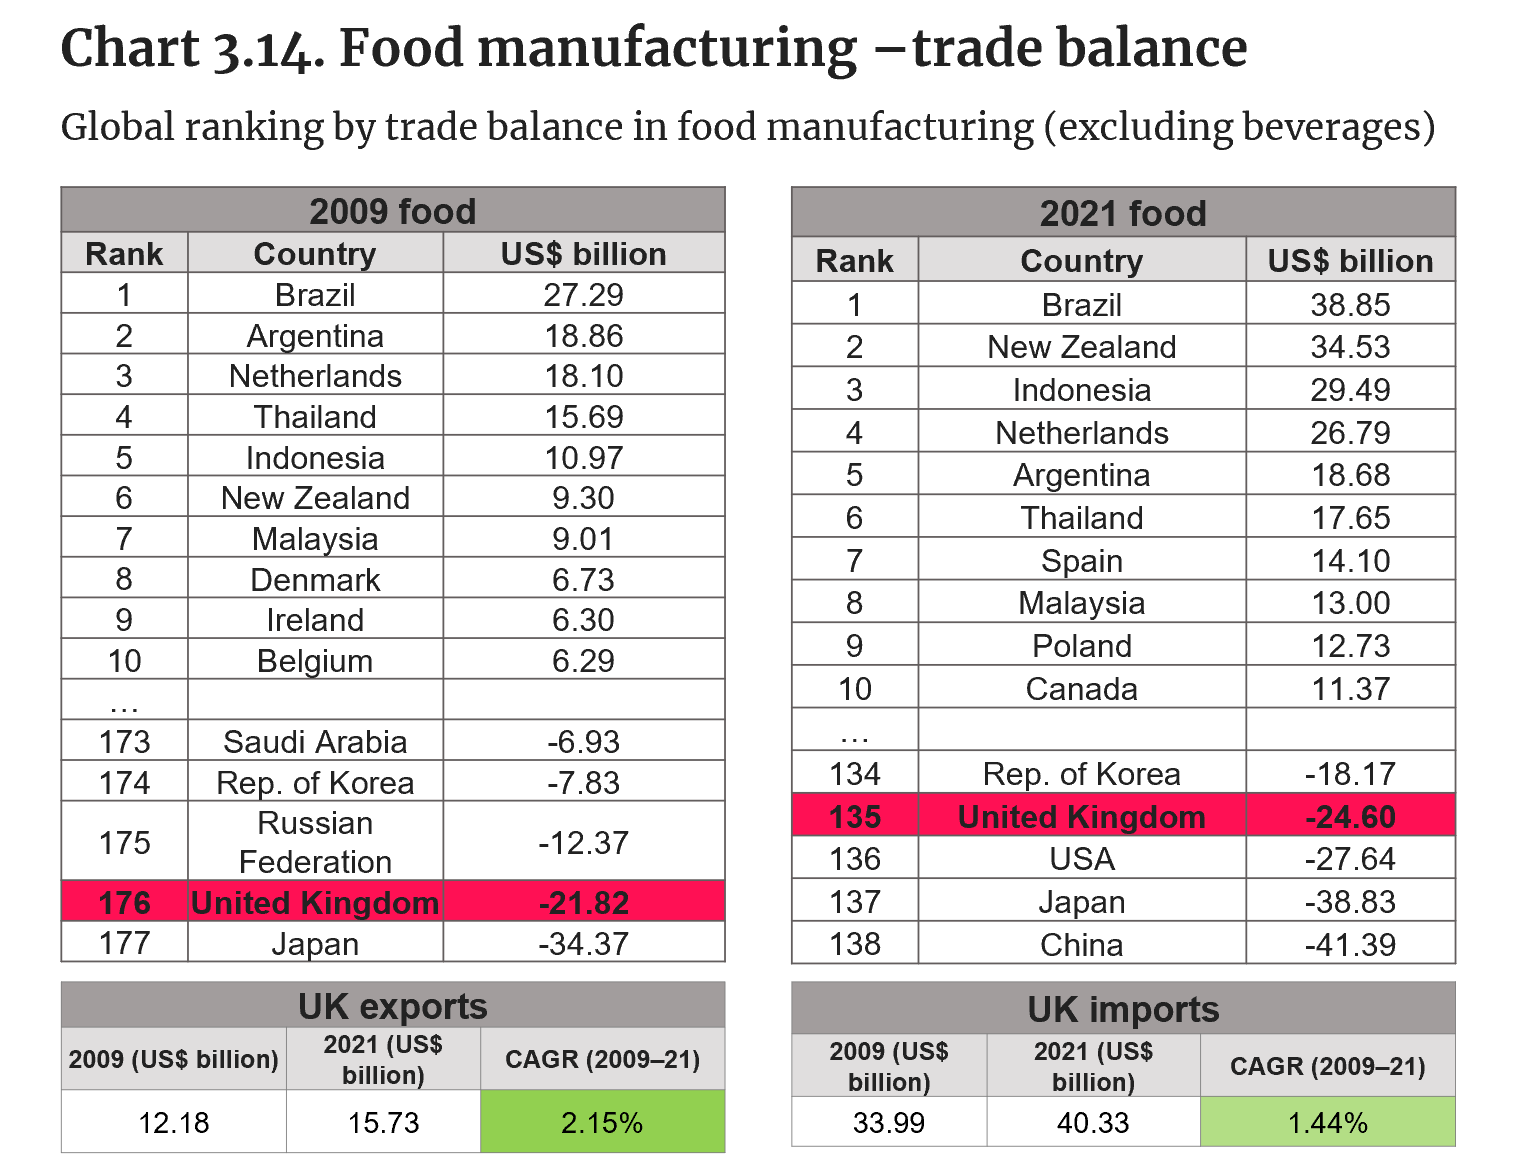
Source: UN Comtrade (accessed in December 2022), HS 2007.
- The UK occupied the lower part of the global food trade balance ranking in both 2009 and 2021, with a total deficit in food trade balance of US$24.6 billion in 2021 (UK food exports totalled US$15.73 billion in 2021, compared to US$40.33 billion in imports).
- Both UK food exports and imports increased between 2009 and 2021. The compound annual growth rate in food exports was 2.15% between 2009 and 2021, while imports recorded a 1.44% CAGR during the same period.
- The UK produces around 60% of its domestic food consumption by economic value, part of which is exported, including the majority of grains, meat, diary and eggs [DEFRA, 2022b]. However, consulted stakeholders shared the view that the UK cannot produce all of the food it consumes because of geography, weather and/or resource and land availability and suitability.
- According to an industry survey by the FDF, the majority of manufacturers are focused on meeting local UK demand, with exports accounting for under 10% of their UK turnover for 58% of the sample [FDF, 2017].
Beverages manufacturing –trade balance
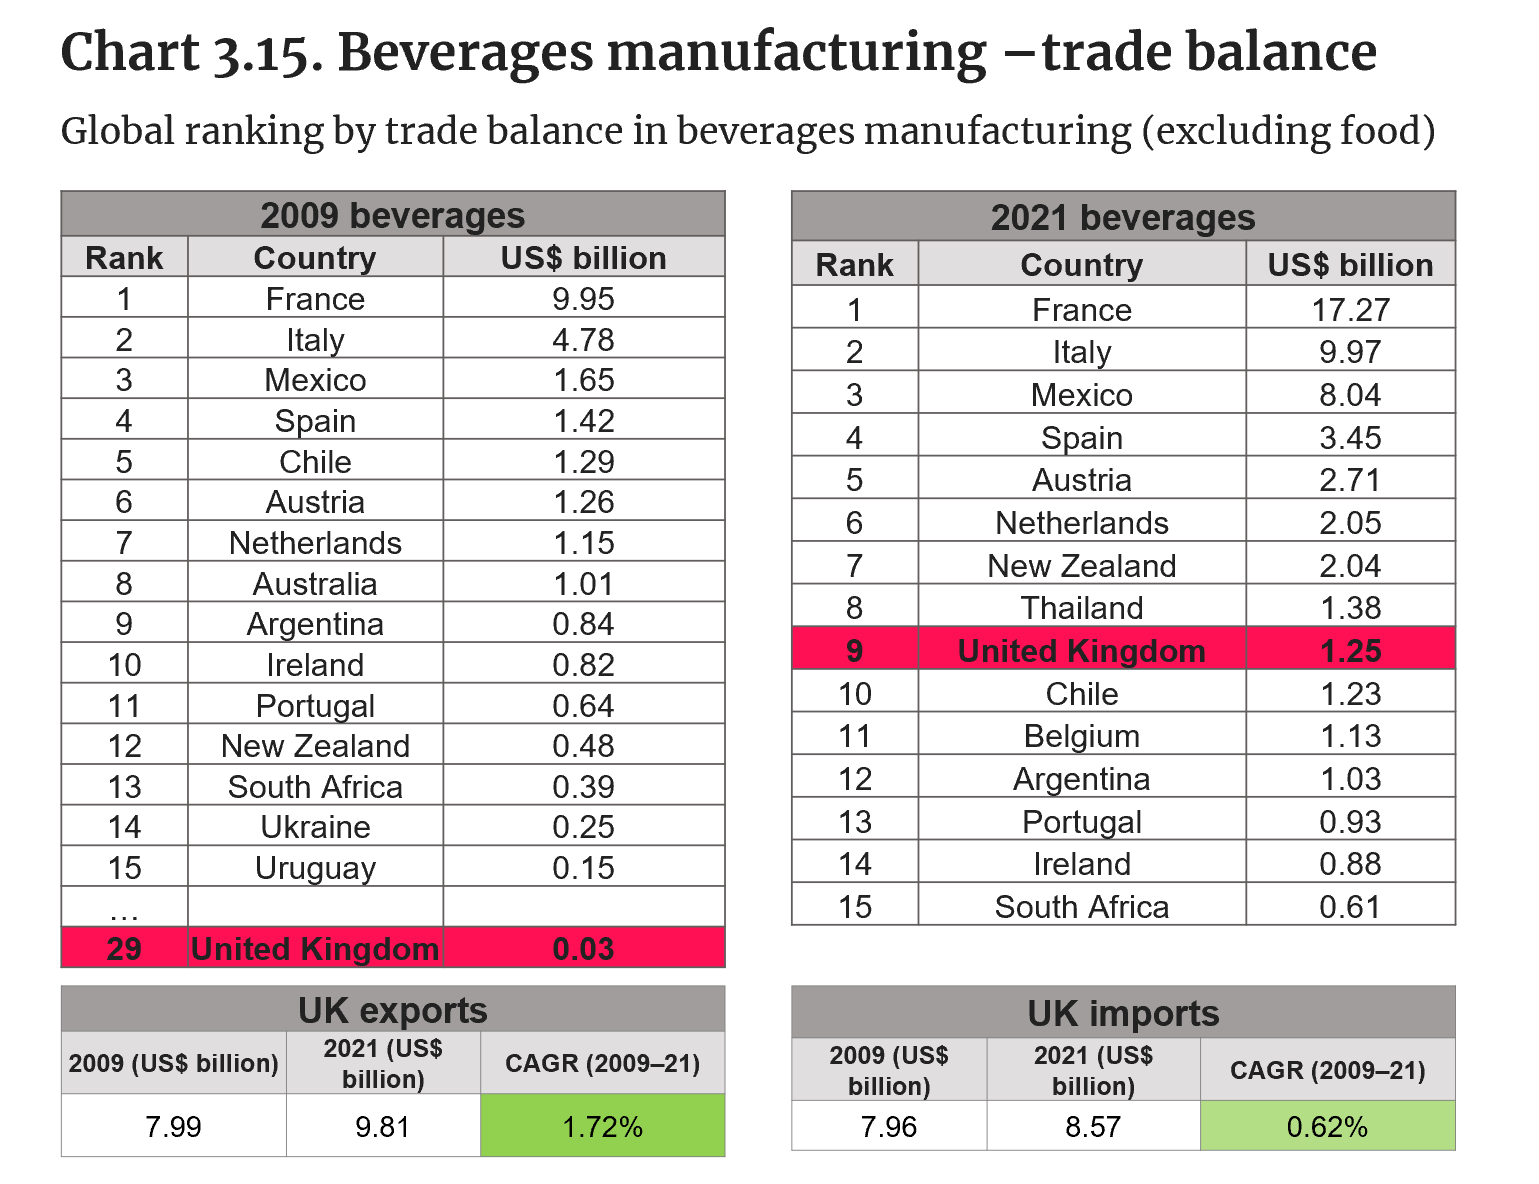
Source: UN Comtrade (accessed in December 2022), HS 2007
- The UK ranked ninth in the global beverages trade balance ranking in 2021, after recording a significant improvement in its position compared to 2009, going from a total balance of US$0.03 billion in 2009 to US$1.25 billion in 2021.
- Both UK beverages exports and imports increased between 2009 and 2021; however, the compound annual growth rate (CAGR) of beverage exports was over 1% larger than that of imports during this time period.
- In 2021 the UK exported beverages totalling US$9.81 billion, while imports totalled US$-8.57 billion.
- France, Italy, Mexico, Spain and Austria were the top five performing countries in terms of beverages trade balance in 2021.
- Alcoholic beverages represented the third-largest share of businesses in the sector in 2017, with roughly the second-highest turnover and highest profits before taxes, above meat and meat product businesses, which had the fifth-highest profits before tax [FDF, 2017].
Food manufacturing – global export market share
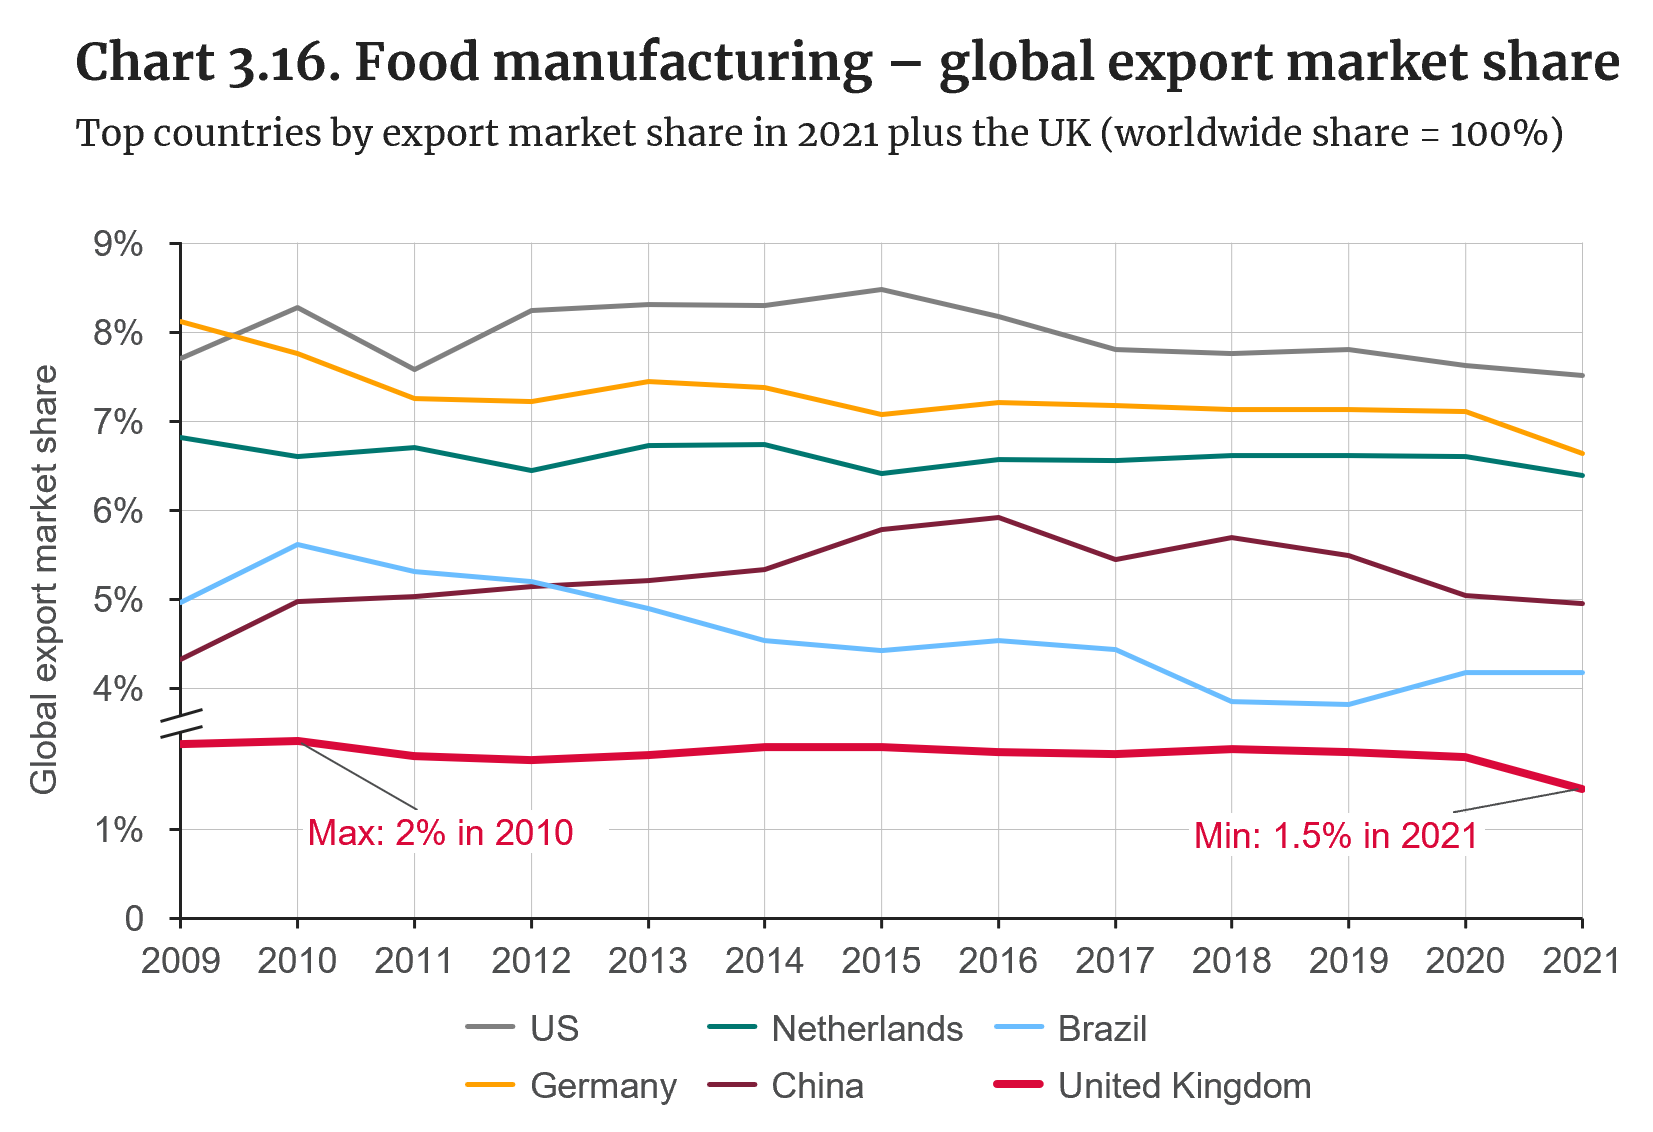
Source: UN Comtrade (accessed in December 2022), HS 2007.
- The US had the largest global export market share (7.5%) in food products in 2021, followed by Germany (6.6%), the Netherlands (6.4%), China (5%) and Brazil (4.2%).
- The UK’s global market share in food exports decreased from 2% in 2010 to 1.5% in 2021. Between 2009 and 2020 the UK’s market share fluctuated around 1.9%, with a noticeable reduction recorded in 2020–21.
- China surpassed Brazil as the fourth-largest global export market share in 2013, maintaining that position until 2021, with a 5% share above Brazil’s 4.2%.
Beverages manufacturing – global export market share
Source: UN Comtrade (accessed in December 2022), HS 2007.
- France had the largest global export market share in beverages in 2021, with 16.3%, followed by Italy (9.1%), the UK (7.3%), Mexico (6.9%), the US (6.6%) and Germany (5.2%).
- The UK’s global market share in beverage exports decreased from 11.2% in 2011 to 7.3% in 2021. Italy surpassed the UK’s export market share in 2019 and has maintained the second-largest share in beverage exports since then.
- Mexico has recorded an upward trend since 2014, surpassing Germany in 2019 and the United States in 2021, with a global beverages export market share just below that of the UK for the last recorded year.
UK food and beverages manufacturing – trade balance
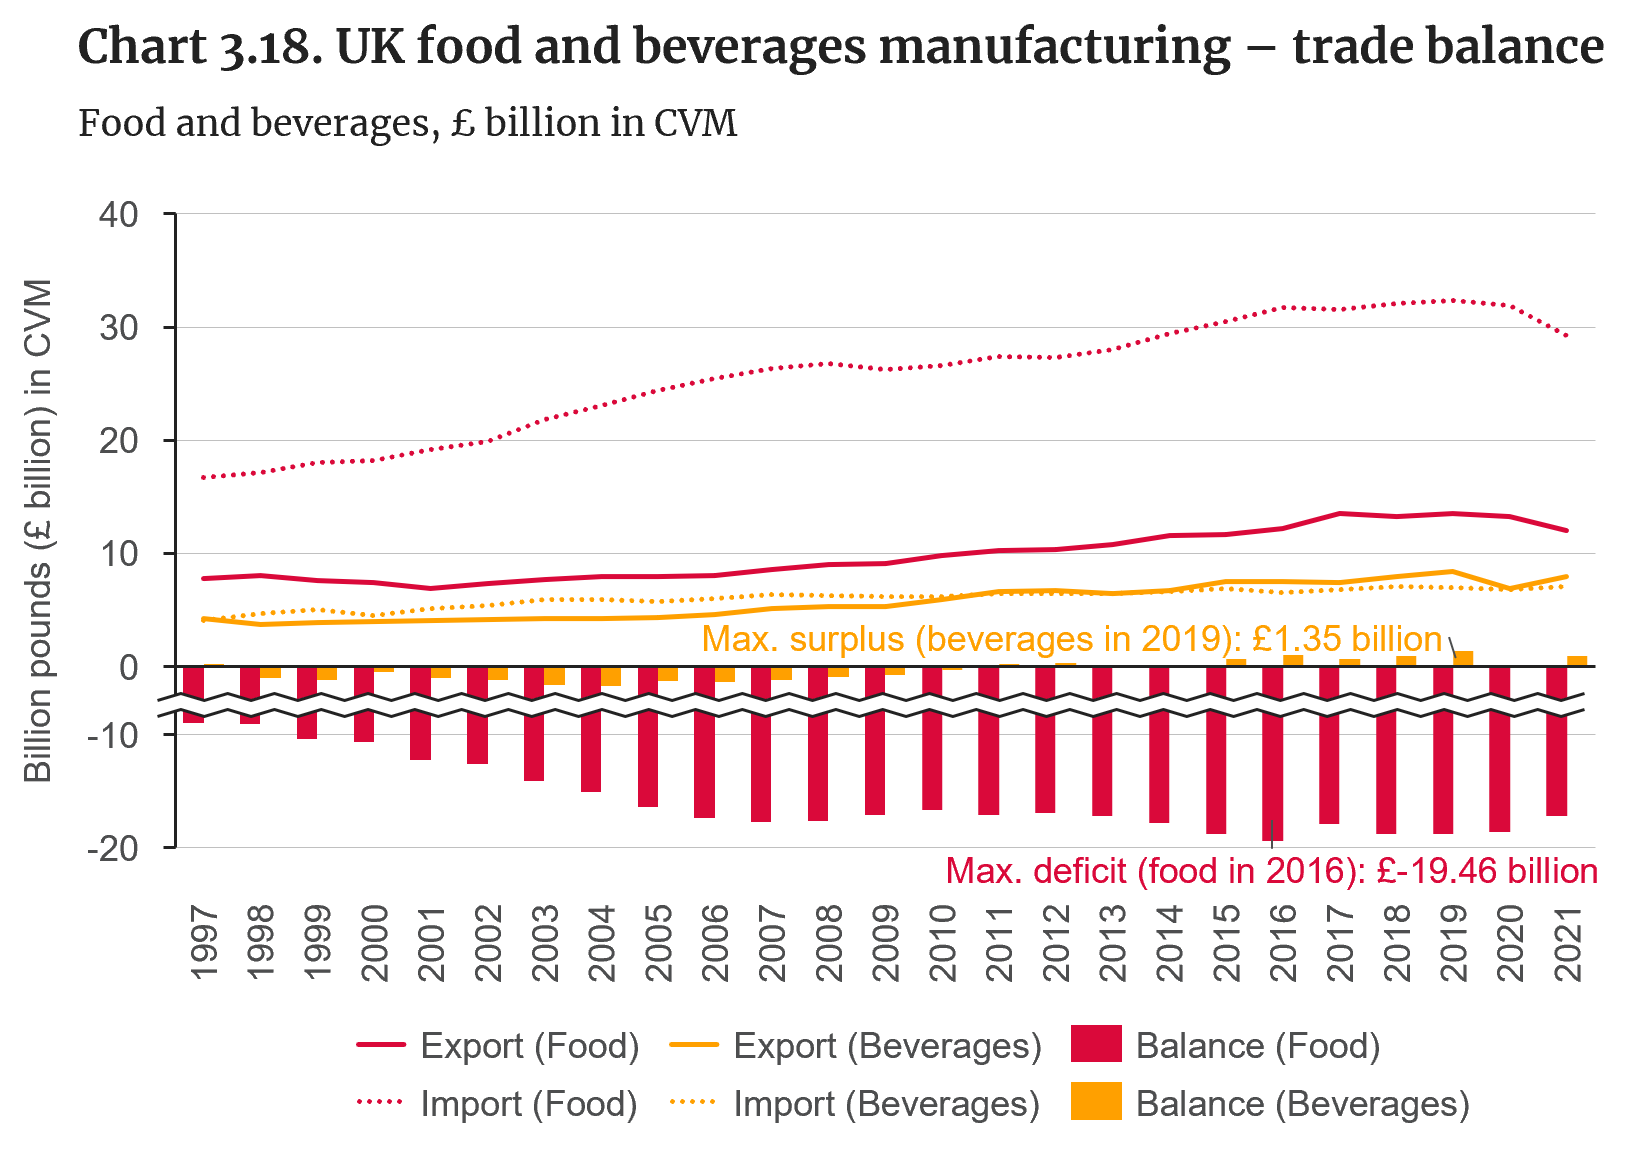
Source: ONS, UK trade in goods by classification of product by activity time series (updated version: 15 December 2022); food (SIC 2007 Code 10), beverages (SIC 2007 Code 11).
- The UK recorded large trade deficits in food products between 1997 and 2021.
- The UK also recorded small trade deficits in beverages between 1998 and 2010, followed by small surpluses since then.
- The UK’s food trade deficit peaked in 2016 with a value of £19.46 billion, while the country’s beverages trade surplus reached a maximum of £1.35 billion in 2019.
- Since the COVID-19 pandemic in 2020, the surplus in beverages trade balance has decreased by £0.49 billion, while the deficit in the food trade balance has reduced by £1.65 billion.
UK food and beverages manufacturing – top export and import products
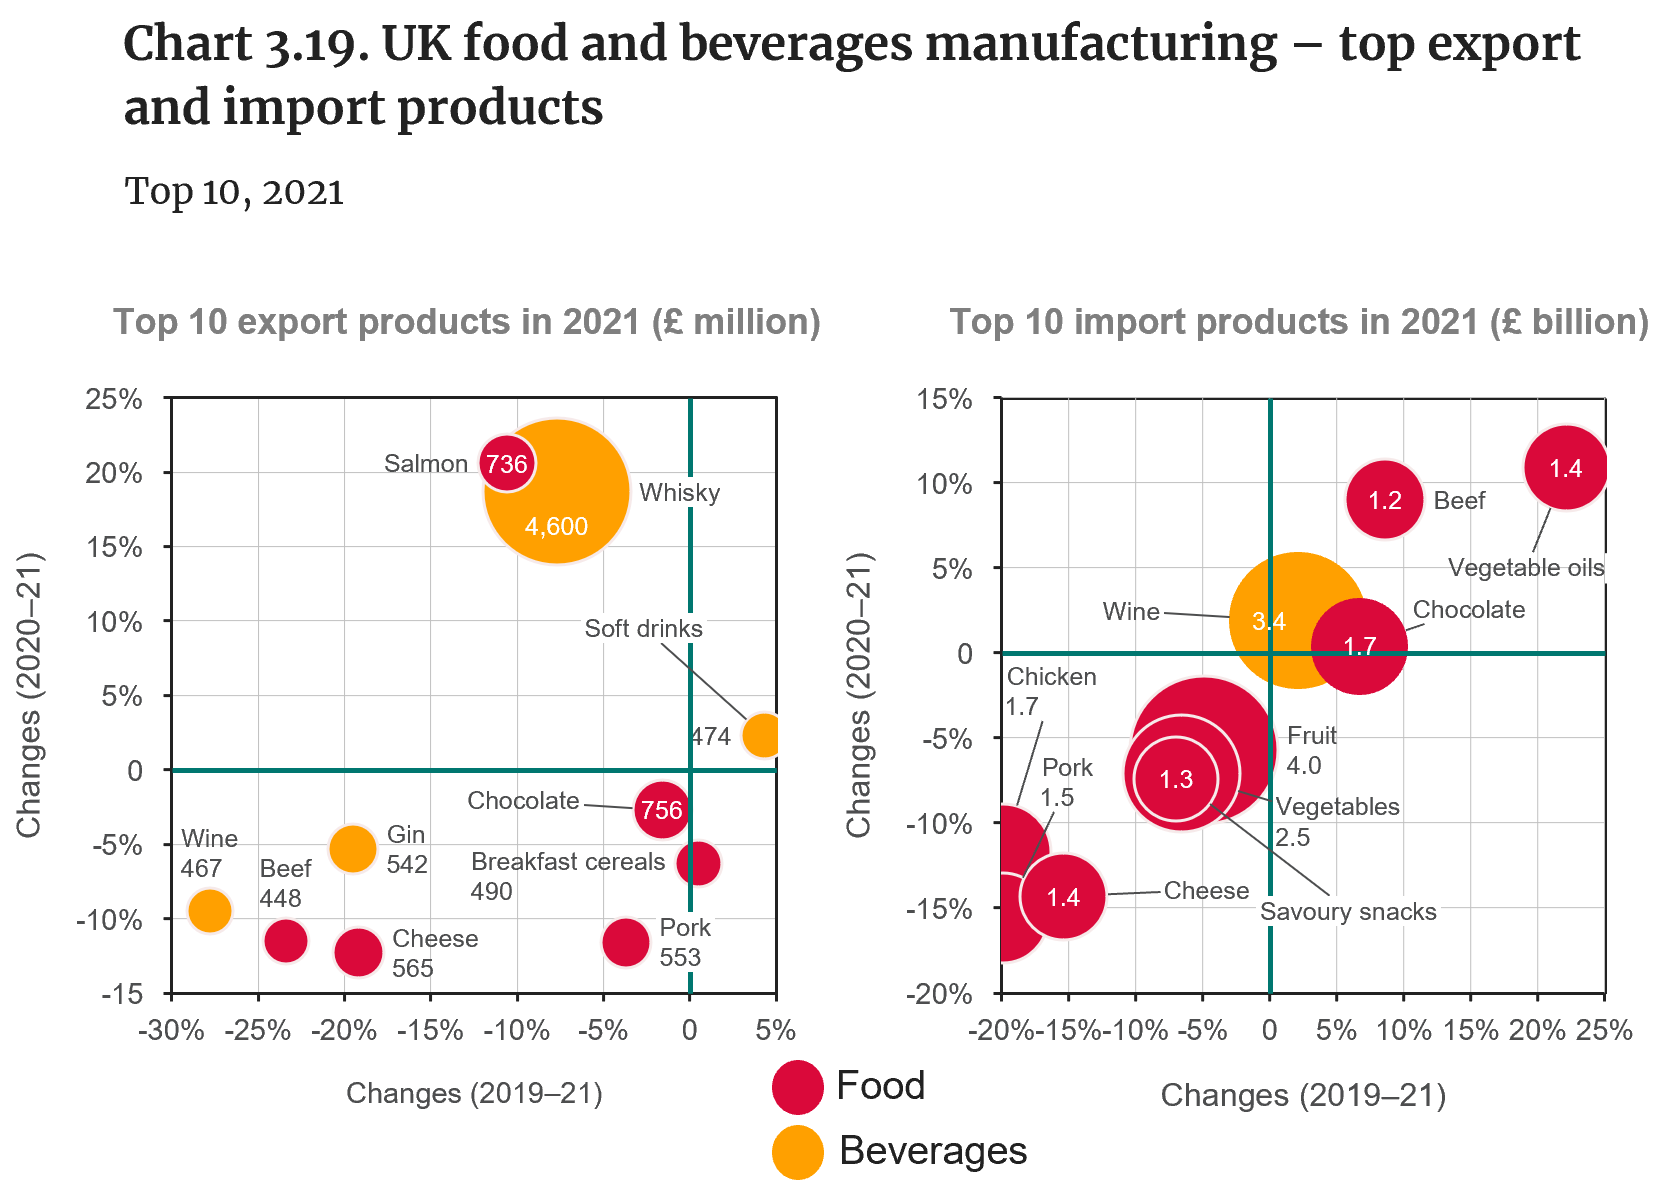
Source: Food and Drink Federation (FDF), 2021 Trade Snapshot.
- Whisky represents the top export product from the UK, with an export value of £4.6 billion in 2021, followed by chocolate exports worth £756 million during the same year.
- Soft drinks are the only product that experienced positive growth in exports between 2019 and 2021 and 2020 and 2021, despite the COVID-19 pandemic.
- Fruits, wine and vegetables were the top three import products in 2021. Of these, only wine imports have increased since 2020.
- Wine is also the only beverage among the top 10 import products. Imports of various top products such as vegetables, pork and chicken have diminished since 2020.
Food and beverages – business spending on R&D
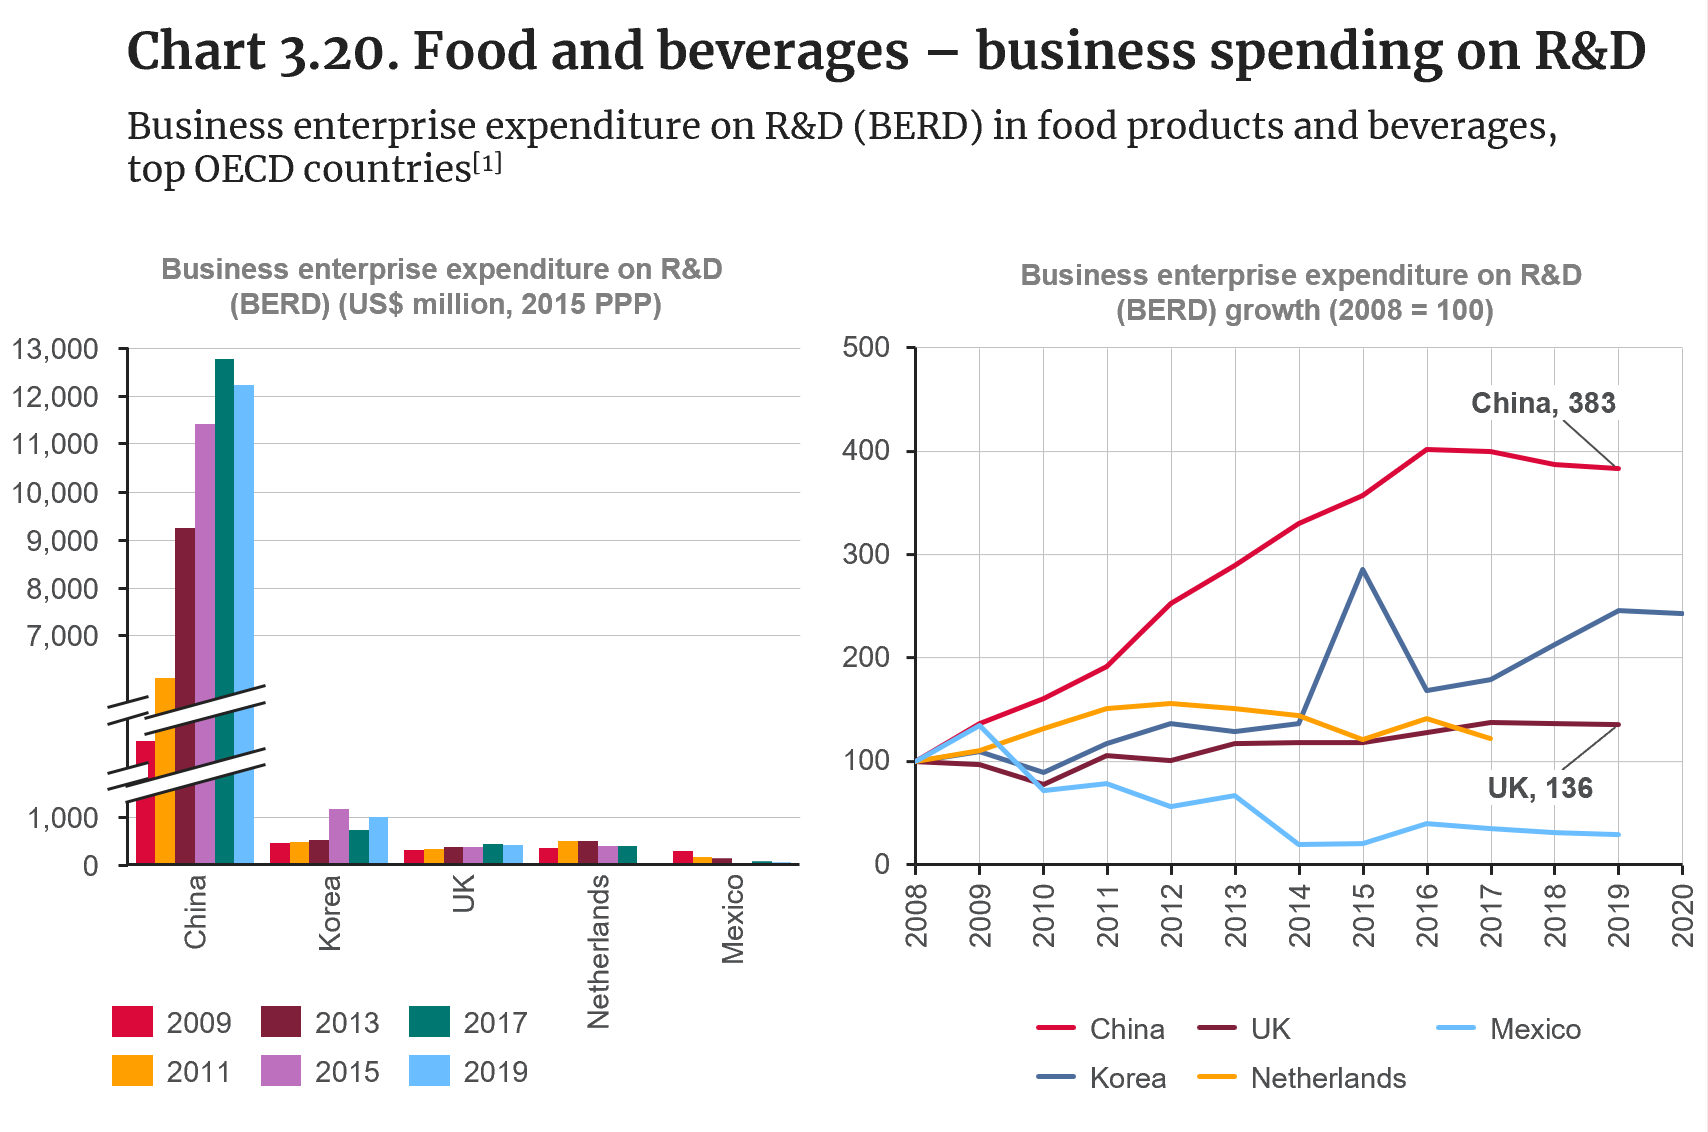
Note: [1] US BERD data unavailable.
Source: OECD Research and Development Statistics, ISIC Rev.4, Code D10T11: food products and beverages.
- In absolute terms, the UK had the third-largest business R&D expenditure among the OECD data sample in 2019 , while China maintains a dominant position, with a significantly larger business R&D expenditure than comparator countries (US data unavailable).
- UK food and beverages businesses invest in R&D at a similar absolute level as those in the Netherlands. However, the Netherlands had the fourth-best trade balance in food and sixth in beverages in 2021, highlighting an export vocation.
- R&D expenditure by UK food and beverages businesses recorded positive yearly growth from 2011 to 2019.
- Overall R&D expenditure by UK food and beverages businesses was 36% higher in 2019 than in 2008, compared to increases of 283% in China, 146% in Korea, and 22% in the Netherlands. Mexico recorded negative yearly growth in business R&D expenditure between 2010 and 2019.
UK food and beverages – business spending on R&D (BERD)
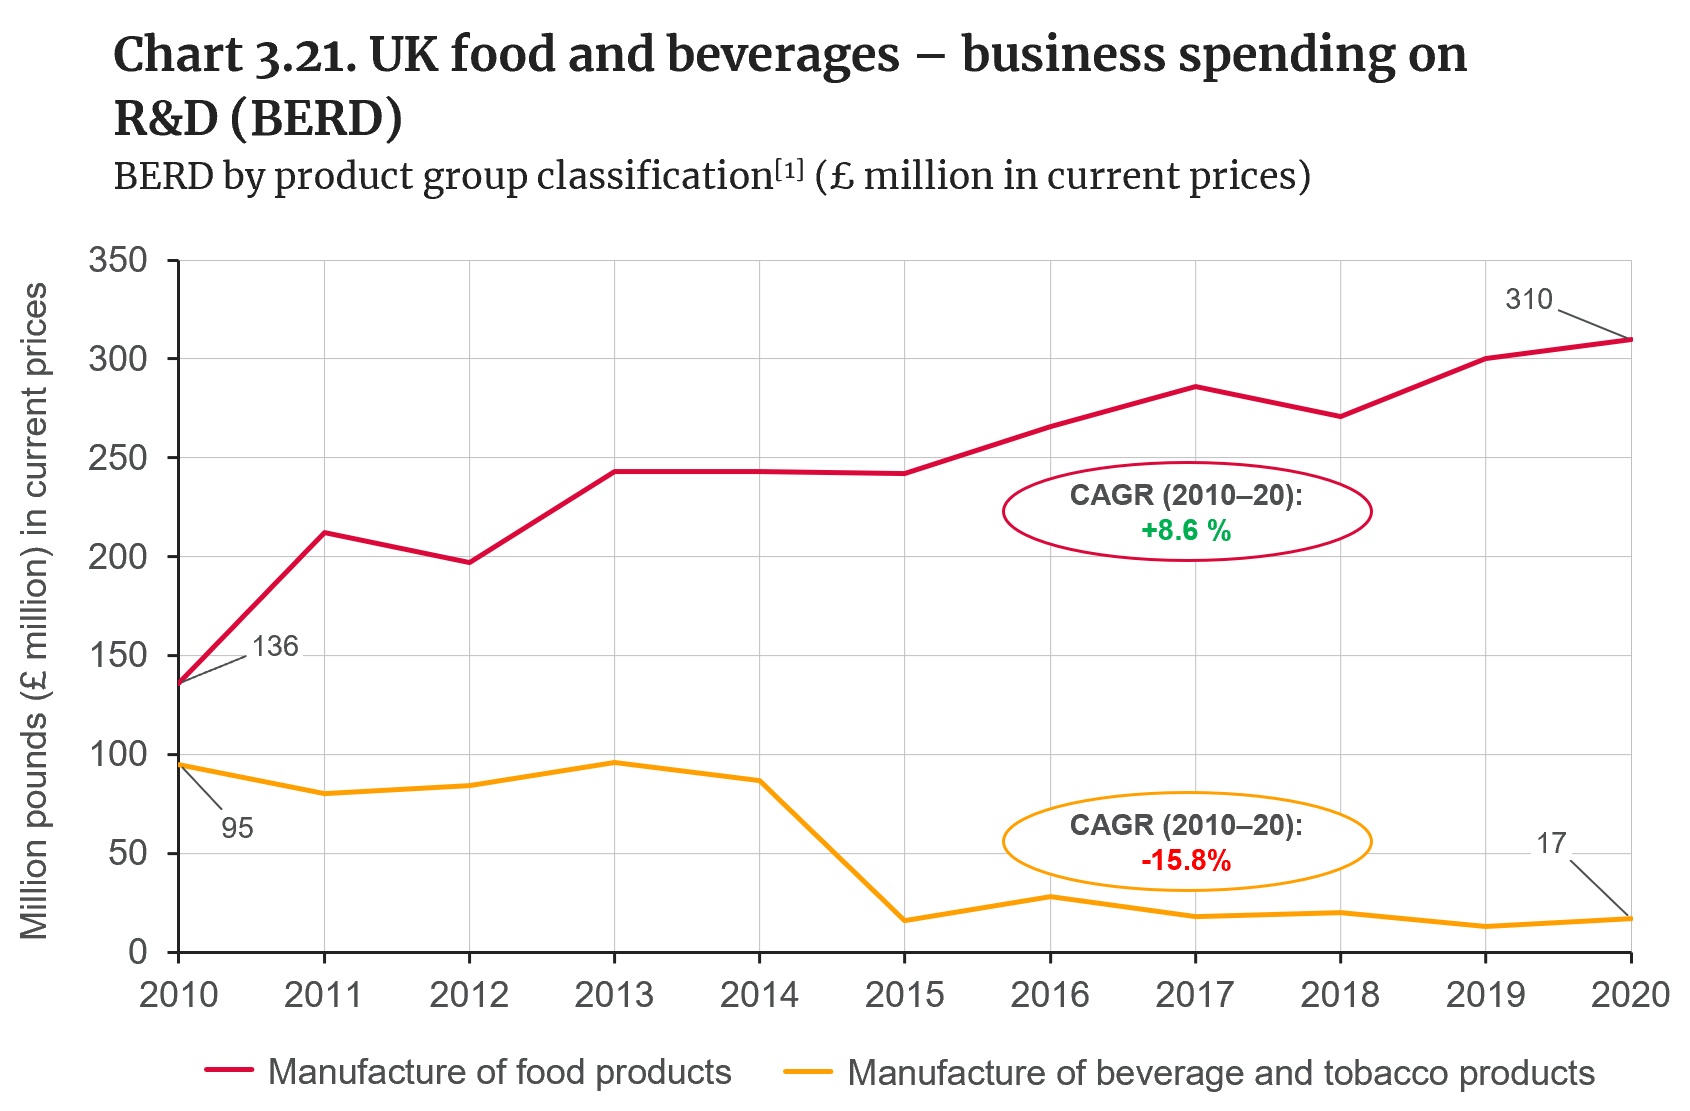
Source: ONS, business enterprise research and development, UK (designated as national statistics) (updated version: 22 November 2022); manufacture of food products (SIC 2007 Code 10), manufacture of beverage and tobacco products (SIC 2007 Code 11 and 12).
Note: New BERD data for 2018–21 under the updated ONS methodology only provides estimates for the manufacturing sector as a whole (Code 10 to 33).
- Based on ONS data, UK business expenditure on R&D (BERD) in food manufacturing has increased since 2010, with a compound annual growth rate of 8.6% between 2010 and 2020 and a total BERD of £310 million in 2020.
- Regarding beverages manufacturing, the ONS publishes annual BERD updates for beverage and tobacco products combined.
- BERD in this category (beverage and tobacco manufacturing) decreased after 2014, with a compound annual growth rate of -15.8% between 2010 and 2020 and a total BERD of £17 million in 2020.
- Product innovation is a core strength of a sector that demands constant improvement to update and introduce new products, which require significant innovation beyond simple repackaging or rebranding [IfM, 2010].
- Just over 11,600 new food and drink products were introduced in the UK in 2021, which reflects the highly competitive nature of the industry [Mintel, 2023].
Note: [1] Developed by the ONS, the term “product group” refers to business R&D expenditure allocated to the product group that best describes the subject type of R&D activities carried out by firms, rather than based on the economic activities SIC classification.
What is driving value added, productivity and trade trends in food and beverages manufacturing?
Key trend identified:
- The value added of the UK food and beverages sector has increased during the last decade, while its productivity remained roughly stable
- The UK has one of the largest food trade deficits among comparator countries, while it remains a leading exporter of beverages
Potential drivers identified from the literature review and consultations with sector experts (see Appendix 3.1 for details):
Demand for the food and beverages sector is inherently resilient to recession and external events
- The consulted stakeholders largely agreed that because food and beverages are essential customer goods, domestic demand for UK food and beverages tends to be more stable than products from other sectors.
- Competition in the grocery retail sector helps to push prices down and shapes consumer preferences based on the highest-value propositions on offer [Make UK, 2020].
- Sector resilience was demonstrated during the 2008 financial crisis. Between May 2008 and May 2009 the production index for food and drink fell by 1.9, compared to 13.1 for manufacturing overall. Exports grew by 5.4% in the first 9 months of 2009, compared with the same period in 2008, compared with the -14.3% performance for all UK commodity exports during the same period [IfM, 2010].
- UK household and eating-out expenditure on food and drink increased between 2001 and 2020 (including during the 2008 financial crisis). Although expenditure reduced in 2021 because of COVID-19, this is attributed to a fall in food and beverages eaten out of the household as a result of restaurants and other licensed premises being shut for large parts of the 2020–21 pandemic period [DEFRA, 2022; DEFRA, 2023].
- Stakeholders also highlighted that UK food and beverage sector resilience is supported by adaptable and flexible supply chains, which have traditionally been capable of resisting external shocks (e.g. economic, climate, trade, transportation, labour) [DEFRA, 2021].
- In addition, close collaboration between the government and the private sector to monitor, anticipate and respond to risks adds to the resilience of UK food and beverages supply chains [DEFRA, 2021].
The sector’s domestic orientation contributes to resilience and food security, while it diminishes the appetite for export markets
- The UK produces around 60% of its domestic food consumption by economic value, part of which is exported, including the majority of grains, meat, diary and eggs, rising to 75% for food that can be grown in the country [DEFRA, 2022b]. This strong and consistent domestic production, combined with a diversity of international supply sources that avoids over-reliance on any one source, translates into a resilient UK food supply, albeit one that is not fully self-sufficient.
- The interviewees suggested that food and drink manufacturers see exports as a secondary priority given the large and consistent domestic market.
- For example, according to an industry survey by FDF, the majority of manufacturers are focused on meeting local UK demand, with exports accounting for under 10% of their UK turnover for 58% of the sample [FDF, 2017]. Potential export barriers identified by stakeholders included product shelf life and the fragile nature of their products [FDF, 2017].
- The share of domestically produced food consumed in the UK increased from 51.1% in 2009 to 53.9% in 2020 [DEFRA, 2021].
- Domestic production has been stable, with consumer demand balanced by imports and exports [DEFRA, 2021].
- For the remaining share coming from abroad, the UK has diverse and longstanding trade links that meet consumer demand for a range of products at all times of the year. However, trade is dominated by countries in the European Union supply chain (28% of UK domestic consumption came from the EU in 2020, while the remaining 18% came from the rest of the world), which has exposed the UK to potential disruptions in the immediate aftermath of the exit from the EU [DEFRA, 2021].
Food and drink exports reflect niche strengths in high-value segments for the UK, which can be expanded to new markets
- As suggested by the FDF and the consulted stakeholders, the UK’s export strengths in food and drink are often driven by innovation built on long-term past investment in food and beverages production processes, brands and local product identities [FDF, 2022].
- Although the EU is still the largest market in the food and drink sector, there is an untapped export potential in non-EU markets, where exports grew 8% in 2021 compared to 2020. Overall, exports to the non-EU market accounted for 44.3% of total UK exports in 2021. New trade agreements such as the UK-Singapore Digital Economy Agreement and UK-South Korea Trade Agreement could further boost exports in the future [FDF, 2021].
Imports are a necessary and inevitable part of the UK food and beverages sector
- The consulted stakeholders shared the view that the UK cannot produce all of the food it consumes because of geography, weather and/or resource and land availability and suitability. This means that, inevitably, some ingredients and products will have to be imported.
- The production to supply ratio has remained stable over the last 2 decades, and for crops that can be commercially grown in the UK this has been around 75% [DEFRA, 2021].
- Products that cannot be produced in the UK, such as rice, have to be imported. These are not only important products for consumer consumption but they also constitute key inputs for UK manufacturing industries such as the milling industry [DEFRA, 2002b].
- Furthermore, imported products and raw materials that are not produced in the UK, such as tropical ingredients, help to extend the availability of produce outside their growing season in the UK [FDF, 2022].
Ready-meal market growth correlates positively to post-2008 financial crisis sectoral recovery
- The consulted stakeholders highlighted that the last decade saw a move by food retailers towards the introduction of ready meals at scale that most likely supported the overall growth of the food and drinks manufacturing sector in the aftermath of the 2008 financial crisis.
- The UK ready-meal market experienced significant growth between 2008 and 2022, with sales of ready meals totalling £3,733 million in 2022, compared to £2,450 million in 2008 [Euromonitor Database, 2023]. The top three retailers by share of ready-meal sales in 2022 included Tesco (17.8%), Marks & Spencer (12.2%) and Sainsbury’s (10.7%) [Euromonitor Database, 2023].
Alcoholic beverages and other food products have been key drivers of sectoral turnover and profitability
- Alcoholic beverages represented the third-largest share of businesses, with roughly the second-highest turnover and highest profits before taxes, above meat and meat product businesses, which had the fifth-highest profits before tax [FDF, 2017].
- The sub-sector known as other food products* not only had the largest share of businesses in the sector over the 2013–15 period but also generated the highest turnover and second-highest profits before taxes, only after the profitability of alcoholic beverage manufacturers [FDF, 2017].
*The other food product sub-sector includes the manufacture of sugar, cocoa, chocolate and sugar confectionery, the processing of tea and coffee, the manufacture of condiments and seasonings, the manufacture of prepared meals and dishes, the manufacture of homogenised food preparations and dietetic food.
A number of concerns are driving policy and industrial strategy to ensure future sector growth
Inflation and rising energy costs:
- As suggested by the consulted stakeholders, the cost of food and beverages manufacturing is intrinsically linked to energy and input costs. Rises in energy and input prices through 2021–22 have been transferred to the food prices paid by consumers [DEFRA, 2023b]. The energy crisis that started in 2022 represents a challenge for food and beverages manufacturing businesses, particularly major energy users such as bakers and millers.
- ONS data shows that higher energy prices had already impacted the production and/or supply of around 60% of food manufacturers back in March 2022, compared to only 38% of all UK businesses [FDF, 2022b].
Sterling depreciation:
- The depreciation of sterling against the dollar since the start of 2022 has driven up the cost of imported ingredients and raw materials. A 2022 industry survey by the Food and Drink Federation found that around 57% of surveyed businesses reported being greatly impacted by the depreciation of sterling [FDF, 2022b].
Labour shortages:
- The consulted stakeholders agree that unfilled vacancies remain a significant issue for UK food and drink manufacturers. For example, an industrial survey by the Food and Drinks Federation found that the number of vacancies per 100 employees increased to 9.1 in Q3 2022, from 6.3 in Q2 2022, while 76% of respondents reported vacancy rates of 0–10% [FDF, 2022b].
- Vacancies cover a wide range of roles and skills, including: high-skilled workers such as engineers, R&D scientists, area supervisors and sales administrators; technical specialists such as food and packaging technologists; and production operatives such as warehouse operators, machine operators, drivers, packers and seasonal workers [FDF, 2022b].
- The consulted stakeholders highlighted automation as key to addressing labour shortages, although this can also lead to a need for upskilling the existing workforce. As suggested by the interviewees and the FDF, more sector-wide efforts are required to better connect the education system and industry to provide skills for the future [FDF, 2017].
Long-term threats
- The consulted stakeholders highlighted a few potential risks to the stability and long-term sustainability of food ingredients and inputs, including: climate change, biodiversity loss, soil and water-quality degradation, and over-exploitation of natural capital resources, including fish stocks and water resources. This view was also shared by DEFRA’s Food Security Report 2021 [DEFRA, 2021].
- The stakeholders viewed climate change as a major factor in medium- to long-term risks to the production of domestic UK food and beverages.
- For example, wheat yields dropped by 40% in 2020 because of heavy rainfall and droughts during the growing season. The concern is that these events could become more frequent and unpredictable in the future, reducing the resilience of the UK food system [DEFRA, 2021].
What is driving business R&D expenditure trends in food and beverages manufacturing?
Key trend identified
- UK business expenditure on food and beverages R&D has increased steadily during the last decade, comparable to other leading OECD nations
Potential drivers identified from the literature review and consultations with sector experts (see Appendix 3.1 for details):
Product innovation is a key focus for the UK food and drink industry
- Just over 11,600 new food and drink products were introduced in the UK in 2021, which reflects the highly competitive nature of the industry [Mintel, 2023].
- Product innovation is a core strength of a sector that demands constant improvement to update and introduce new products, which require significant innovation beyond simple repackaging or rebranding. This competitive need is driving a sectoral push for investment in design and technology research and development (R&D) [IfM, 2010].
UK business and government R&D investments are driven by the need to create a more resilient and nutritious food supply
- The Knowledge Transfer Network (KTN) has identified five areas driving food and drink R&D efforts: i) healthier and more nutritious food; the use of agricultural and food-processing side-stream materials to produce nutritious food ingredients; the development of products based on sustainable sources of new materials and protein; flexible and scalable manufacturing solutions; and digital manufacturing [KTN, 2018].
- The consulted stakeholders also highlighted low-emission production systems, food safety, packaging, recycling and lightweighting, and CO2 traceability as key R&D areas for the future.
- In particular, the consulted stakeholders see biotechnology for new food and drink products as a key innovation trend in recent years and one where the UK can become a global leader. Biotechnology for agriculture and food and drink manufacturing includes areas such as biopesticides, biofertilisers, the production of cultured meat, genetic engineering for agrifood, bioagrochemicals, biotech-produced flavours and fragrances, and viticulture and plant-based proteins for yogurt, milk, egg and cheese products as an alternative to dairy and egg-based goods, among others [IfM, 2023].
Emerging regulations and high-level policy targets have partly shaped the direction of innovation efforts
- The sugar tax: Introduced in April 2018, the tax was aimed at incentivising drink manufacturers to reduce the sugar content of soft drinks as a way to protect the public from excessive sugar consumption. The effect on beverage manufacturers’ recipes was significant: even before its imposition, over 50% of manufacturers took action to cut sugar in their products [Make UK, 2020].
- Plastic packaging tax and related initiatives: Implemented in April 2022, the plastic packaging tax is aimed at reducing the use of plastics and increasing its recycling and collection [HMRC, 2022]. A previous initiative, the UK Plastics Pact, was launched in April 2018 by WRAP and supported by DEFRA, to set targets to reduce single-use packaging and increase the use of recyclable plastic packaging [WRAP, 2023]. In addition, the new extended producer responsibility (EPR) for packaging came into effect on 1 January 2023 to reduce unnecessary packaging and increase packaging recyclability [HMG, 2023].
- Sustainability and net-zero targets: The UK’s net-zero emissions targets, which passed into law in 2019, require major changes in the food system, with many UK-based food and drinks companies establishing net-zero targets (e.g. Danone, Innocent, McCain, Nestlé, Tate & Lyle). This involves addressing key emissions sources in food ingredients, packaging, manufacturing, and distribution and storage, among other areas. Key areas of net-zero innovation for manufacturers include energy efficiency, electricity decarbonisation, process heat decarbonisation and the creation of sustainable refrigerants, as well as opportunities to extend shelf life, cut waste, increase efficiency of refrigeration and replace single-use plastics [FDF, 2021b]. Failure to comply with net zero standards could lead to competitiveness losses against foreign producers, as suggested by consulted stakeholders.
- Food-waste targets: Roughly 16% (1.5 million tonnes) of total UK food waste was caused by food manufacturers in 2018 [WRAP, 2020]. The UK government has committed to meeting the UN Sustainable Development Goal to halve per capita food waste and reduce food loss by 2030; in line with this, the Waste and Resources Action Programme and the Institute for Grocery Distribution launched the Food Waste Reduction Roadmap in 2018, establishing a series of milestones for retailers, food producers, manufacturers and hospitality and food-service companies to meet in order to tackle food waste in the UK. By 2020, 162 food producers and manufacturers representing 50% of the entire sector (by turnover) had joined this initiative [WRAP, 2020].
Automation and digitalisation are seen as opportunities to increasing sectoral productivity. However, economic and demand uncertainty may diminish business confidence and investment in these solutions
- According to the consulted stakeholders, the implementation of automation solutions and other digital technologies has been a consistent innovation trend in the sector in recent years. Data from the British Automation and Robot Association (BARA) indicates that sales of individual robots to domestic food and beverages manufacturers had an annual growth of 35% in 2020 and 21% in 2021 [Food Manufacture, 2022].
- However, investment confidence in the food and drink manufacturing industry has fallen in the last couple of years, with the FDF’s net confidence tracker reaching a record low of -79% in Q3 2021. Furthermore, short-term contracts with retailers might not provide the necessary long-term security to commit to high capital investments in automation, as suggested by consulted stakeholders.
- This highlights an environment of business uncertainty fuelled by events such as the ongoing war in Ukraine and rising energy prices and inflation rates. According to FDF’s State of the Industry Report 2022 Q3, low confidence has prevented some food and drink businesses from investing in the adoption of automation to solve labour shortages, while over half of businesses in the FDF survey sample have prioritised investment in energy efficiency and fuel-switching over automation as a way to reduce costs [FDF, 2022b].


