
Theme 2
Investment in Innovation
Policy questions and key messages
- Is the UK spending enough on R&D?
- How do the public and private sectors contribute to national expenditure on innovation?
- How does the UK compare with other countries?
A new methodology introduced by ONS has pushed the estimate of UK expenditure on R&D up by 55%
- The UK’s gross domestic expenditure on R&D (GERD) as a percentage of GDP was thought to be around 1.7%.
- The Office for National Statistics (ONS) has introduced a major revision, which has pushed this figure up to 2.7%.
- The UK still lags behind Germany, the US and South Korea, which invested between 3.2% and 4.6% of GDP on R&D.
The UK government’s expenditure on R&D remains relatively low compared to OECD countries
- The ONS revised methodology has not impacted the estimate of R&D performed by the UK government.
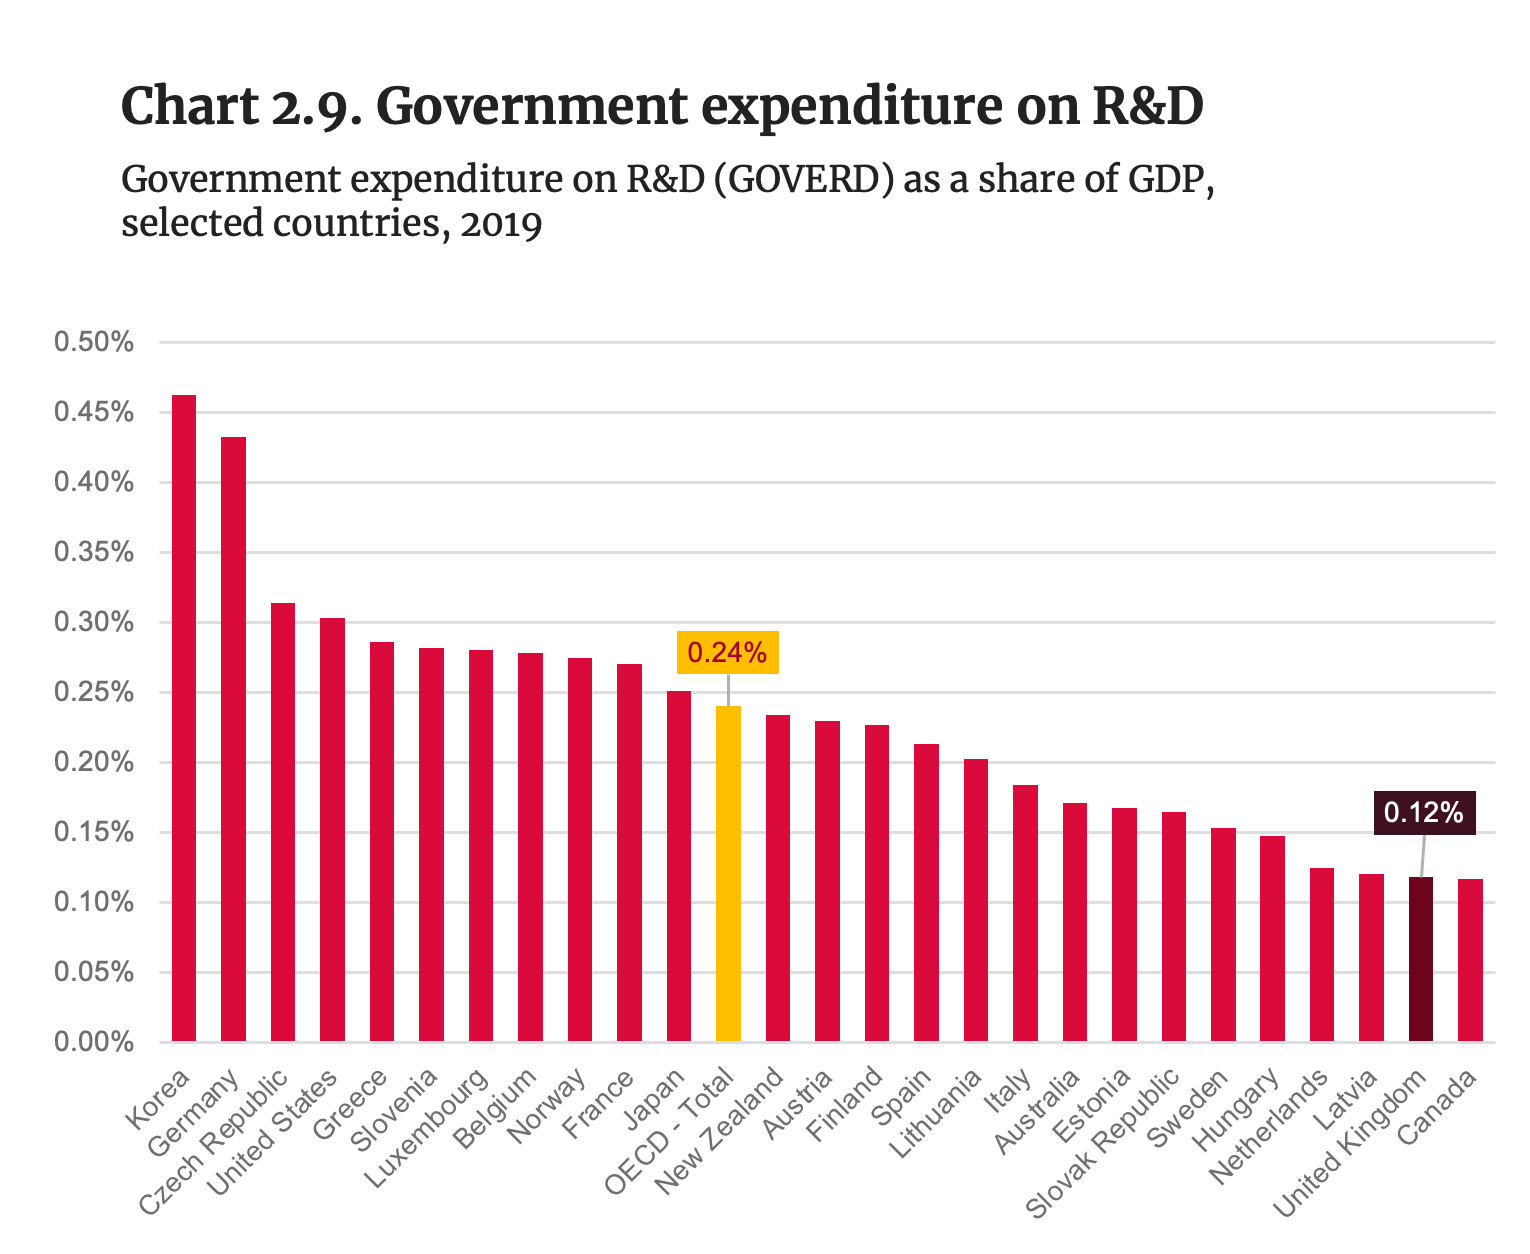
- In 2019 UK government expenditure on R&D as a share of GDP was 0.12%, well below the OECD average of 0.24%.
- In the UK the business sector is the main contributor to R&D performance (71.2% in 2020), and non-business R&D is concentrated around the higher education sector (22.5% in 2020).
Few firms with headquarters in the UK are among the world’s top R&D investors and patent applicants
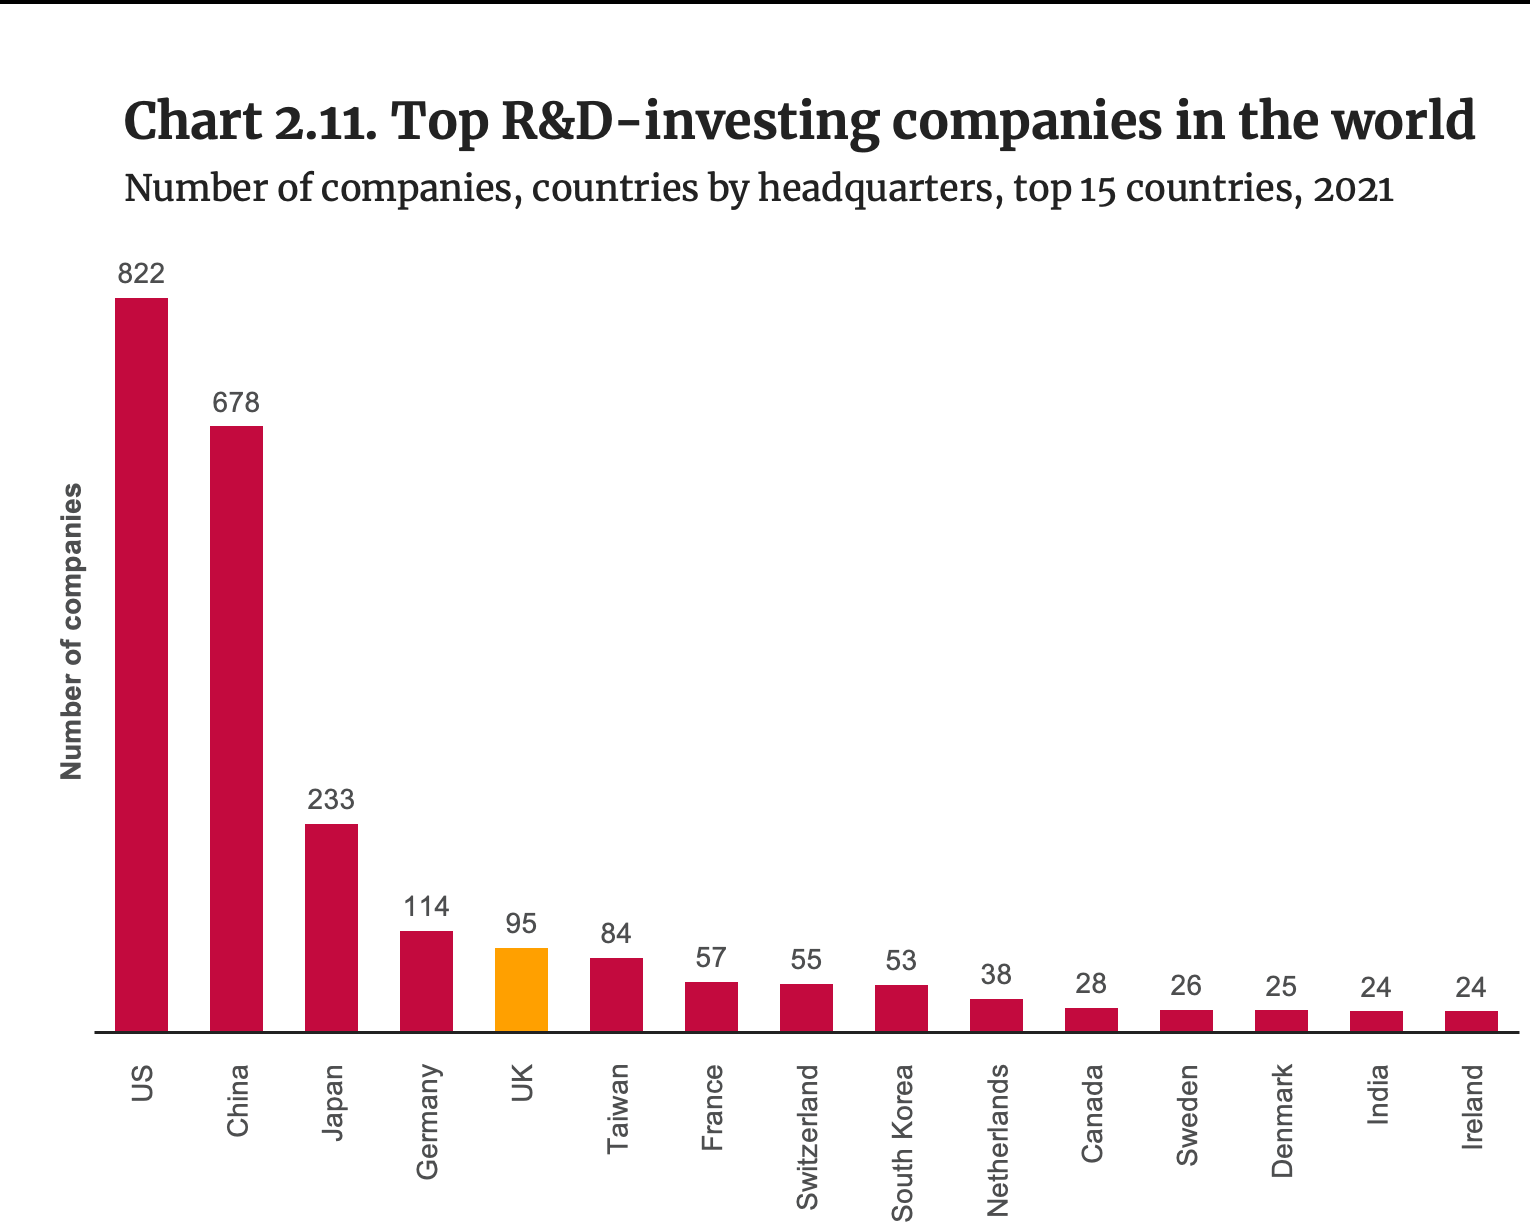
- In 2021, 95 of the world’s 2,500 top R&D-investing companies were headquartered in the UK, behind the US (822), China (678), Japan (233) and Germany (114).The UK hosted only 3 of the top 100 R&D-investing firms in the world in 2021.
- In 2021 there were no UK-headquartered applicants among the top 100 applicants at the United States Patent and Trademark Office (USPTO) and only 1 among the top 100 applicants at the European Patent Office (EPO).
R&D intensity: international comparison (1/2)
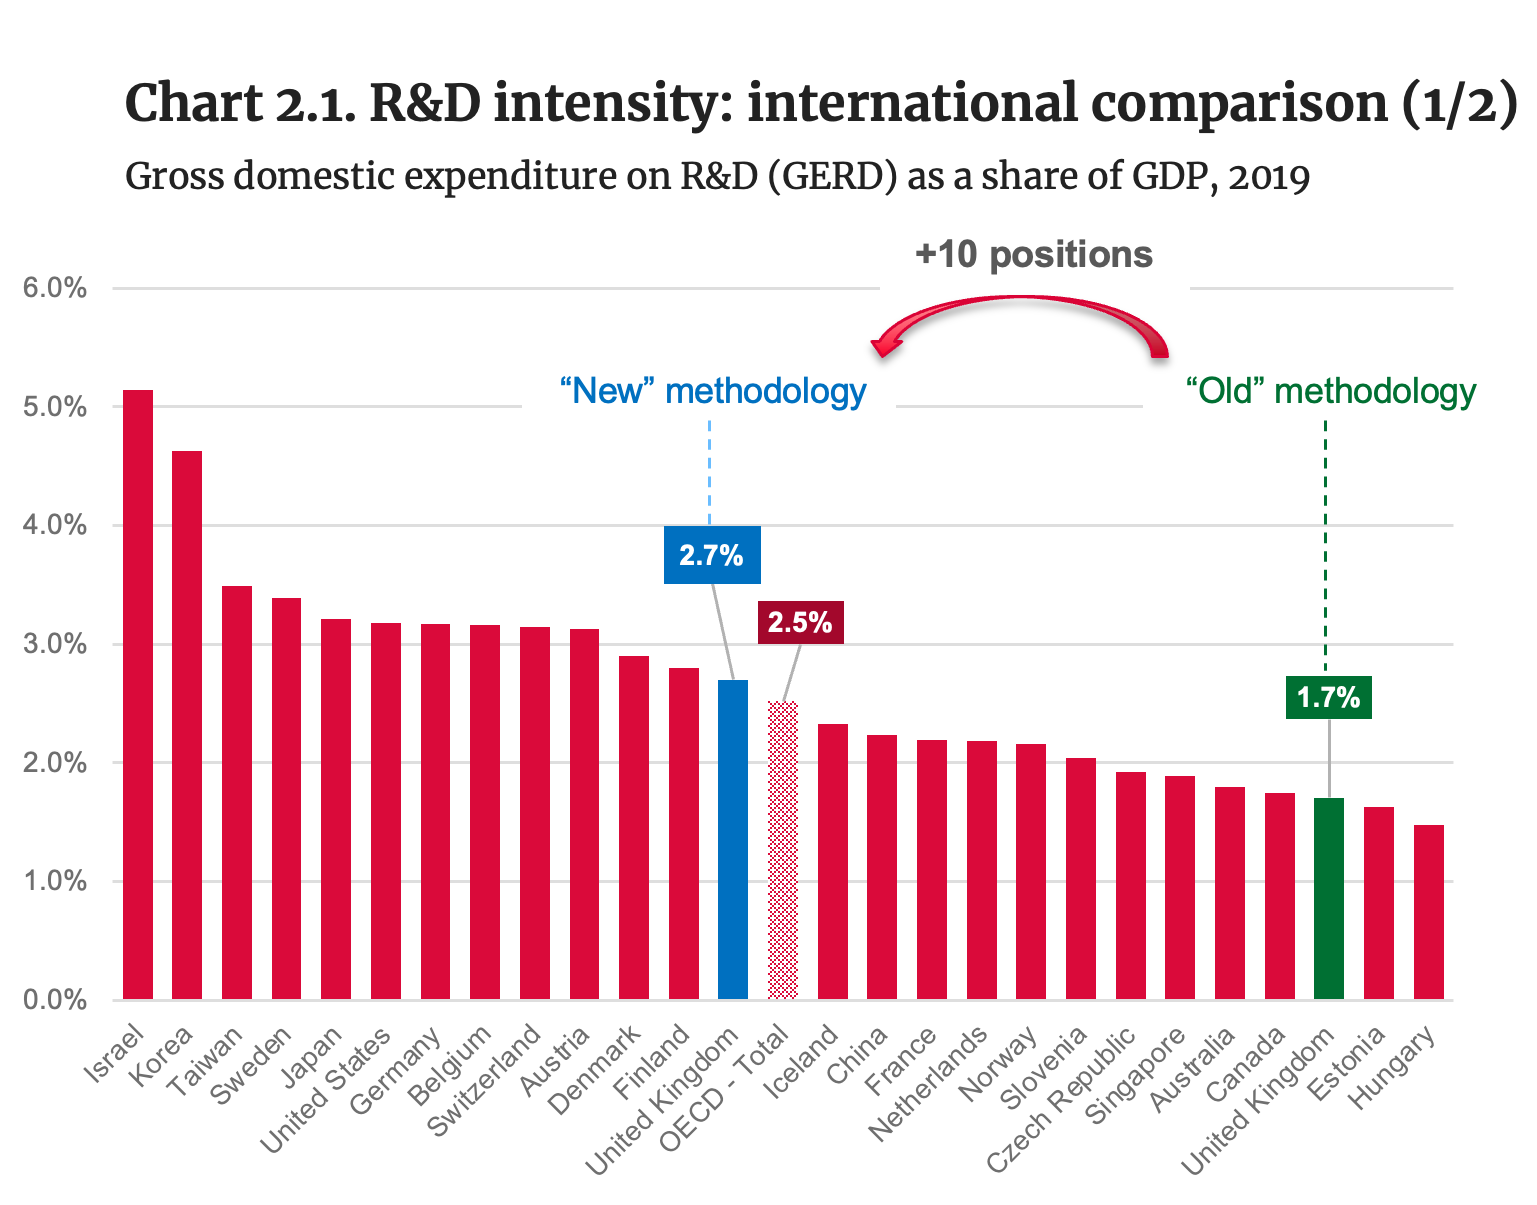
Source: OECD (2022). Main Science and Technology Indicators. For the DSIT estimate of UK R&D as a share of GDP value, see Nurse P. (2023). Independent Review of the Research, Development and Innovation Organisational Landscape – Final Report and Recommendations.
Note: For the UK, the value of gross domestic expenditure on R&D as a share of GDP was estimated by the Department for Science, Innovation and Technology (DSIT) to be between 2.6% and 2.7% in 2019, based on the ONS methodological revision of BERD methodology. (For 2020, DSIT estimated UK R&D intensity to be between 2.9% and 3.0%, a value that is relatively high as a result of the contraction of GDP associated with COVID-19 lockdowns).
- The UK’s gross domestic expenditure on R&D (GERD) as a percentage of GDP was thought for many years to be around 1.7%.
- In November 2022 the Office for National Statistics (ONS) introduced a major revision to the methodology used to estimate R&D performed by businesses and the higher education sector.
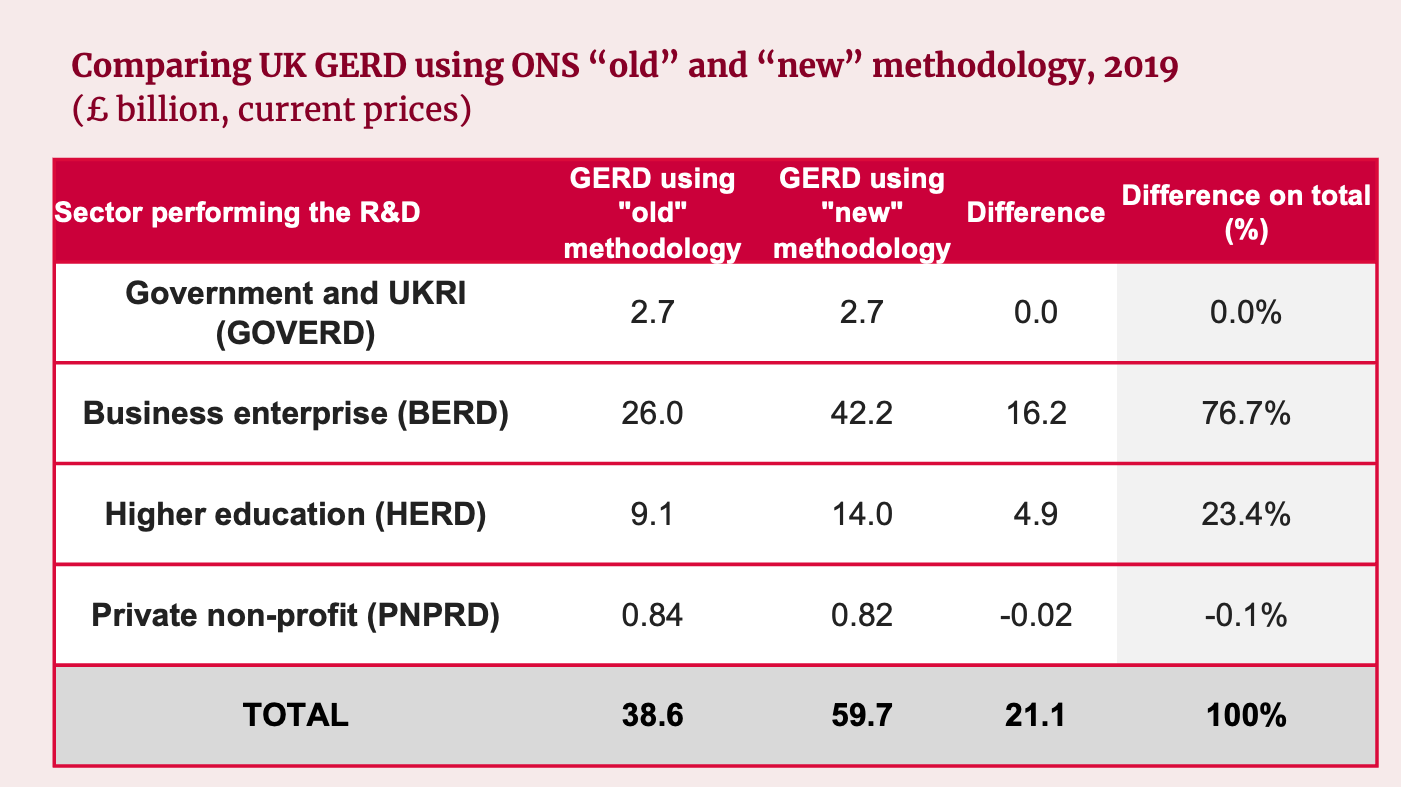
- Using the “new” revised methodology, for 2019:
- UK GERD goes up to £59.7 billion (55% more than using the “old” methodology).
- UK GERD as a share of GDP for 2019 goes up to 2.7% (above the OECD average of 2.5%).
- The UK gains 10 positions in the OECD ranking of R&D intensity for 2019.[2]
- The UK still lags behind Germany, the US and South Korea, which invested between 3.2% and 4.6% of GDP on R&D.
Note: [1] ONS (2022). Gross domestic expenditure on research and development, UK: 2020 (published on 22 November 2022). [2] OECD (2022). Main Science and Technology Indicators.
R&D intensity: international comparison (2/2)
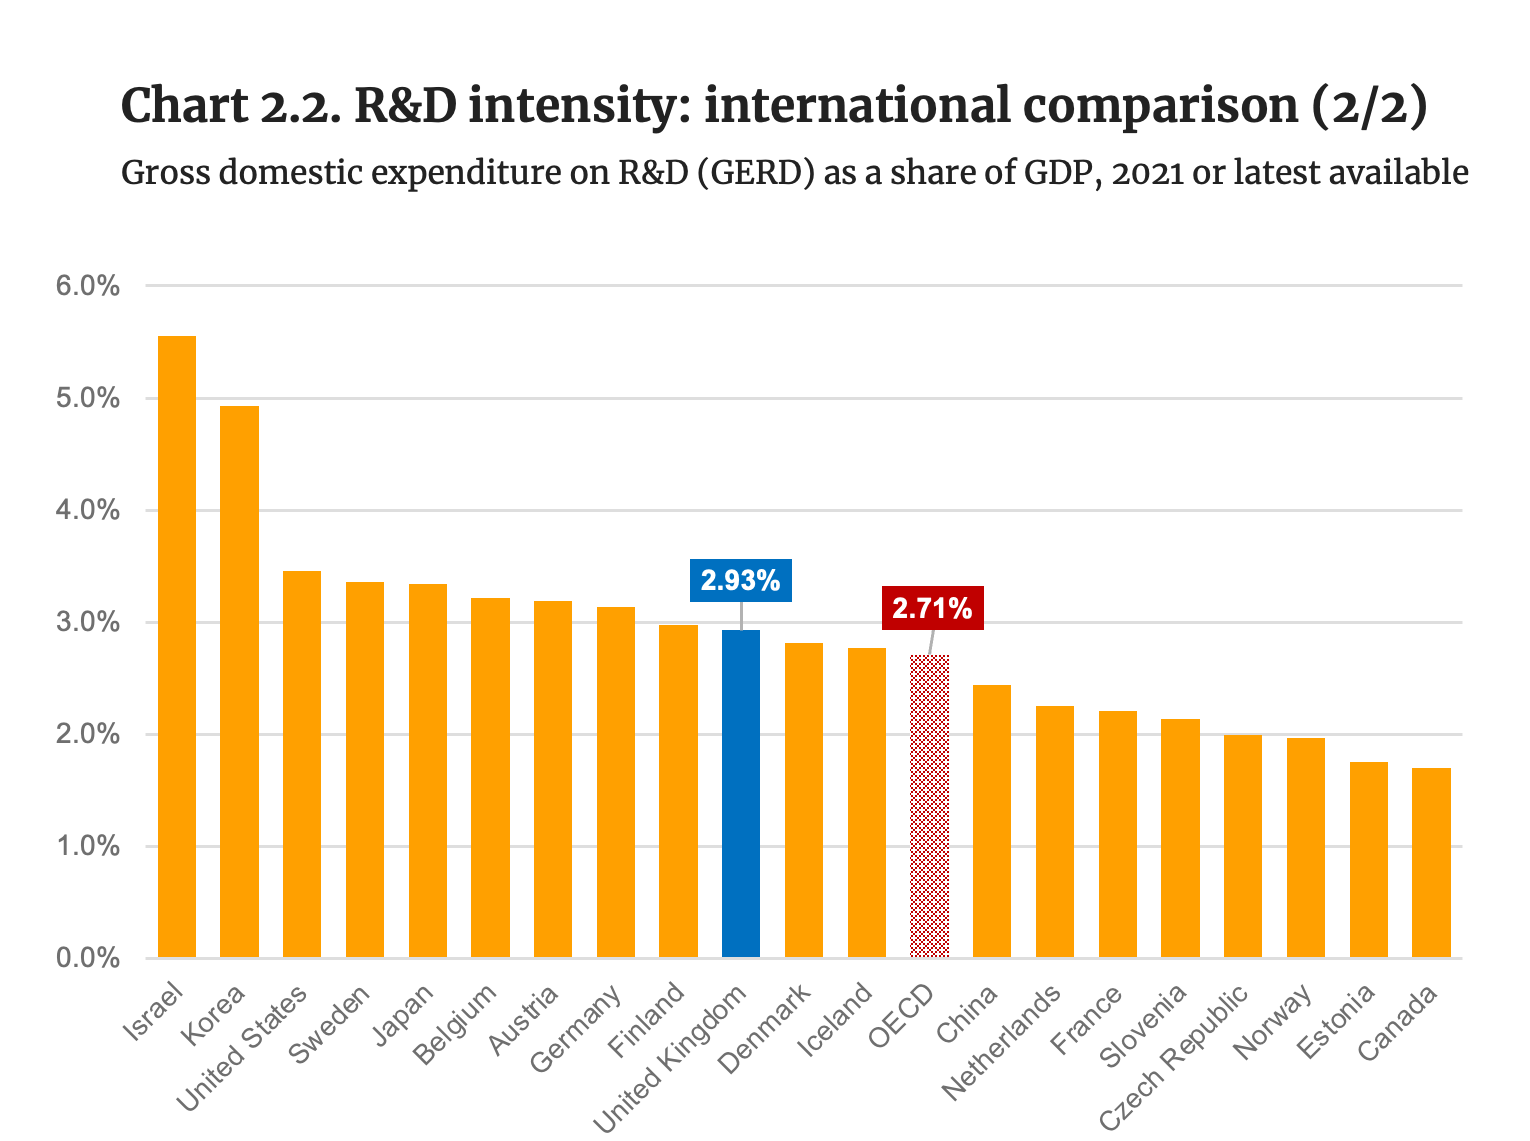
Source: OECD (2023). OECD Science, Technology and Innovation Outlook 2023: Enabling Transitions in Times of Disruption, OECD Publishing, Paris.
Note: Data for the United Kingdom refer to 2020.
- The latest edition of the OECD Science, Technology and Innovation Outlook 2023, released in March 2023, provides updated estimates of gross domestic expenditure on R&D (GERD) as a share of GDP for OECD member states and partner countries.
- Taking into account the ONS methodological revisions, the OECD estimated the value of UK GERD as a share of GDP to be 2.93% for 2020, above the OECD average of 2.71%.
- This is in line with the estimation provided by the UK’s Department for Science, Innovation and Technology (DSIT), which is between 2.9% and 3.0% for 2020.[1]
- The relatively large values for 2020 reflect the contraction of UK GDP associated with COVID-19 lockdowns.
💡 Related insight
The ONS methodological revisions to estimate the gross domestic expenditure on R&D performed in the UK were also justified by the need to be aligned to methodologies used by other countries, particularly with respect to the sampling method used. [2] Following the ONS revisions effective from 2018, data series for previous years related to the UK R&D were suppressed from the data available to OECD. [3]
Note: [1] Nurse: P. (2023). Independent Review of the Research, Development and Innovation Organisational Landscape – Final Report and Recommendations. [2] ONS (2022). Options for transformation of business enterprise research and development statistics (published on 22 November 2022). [3] OECD (2023). OECD Science, Technology and Innovation Outlook 2023: Enabling Transitions in Times of Disruption, OECD Publishing, Paris.
ONS revision of BERD methodology
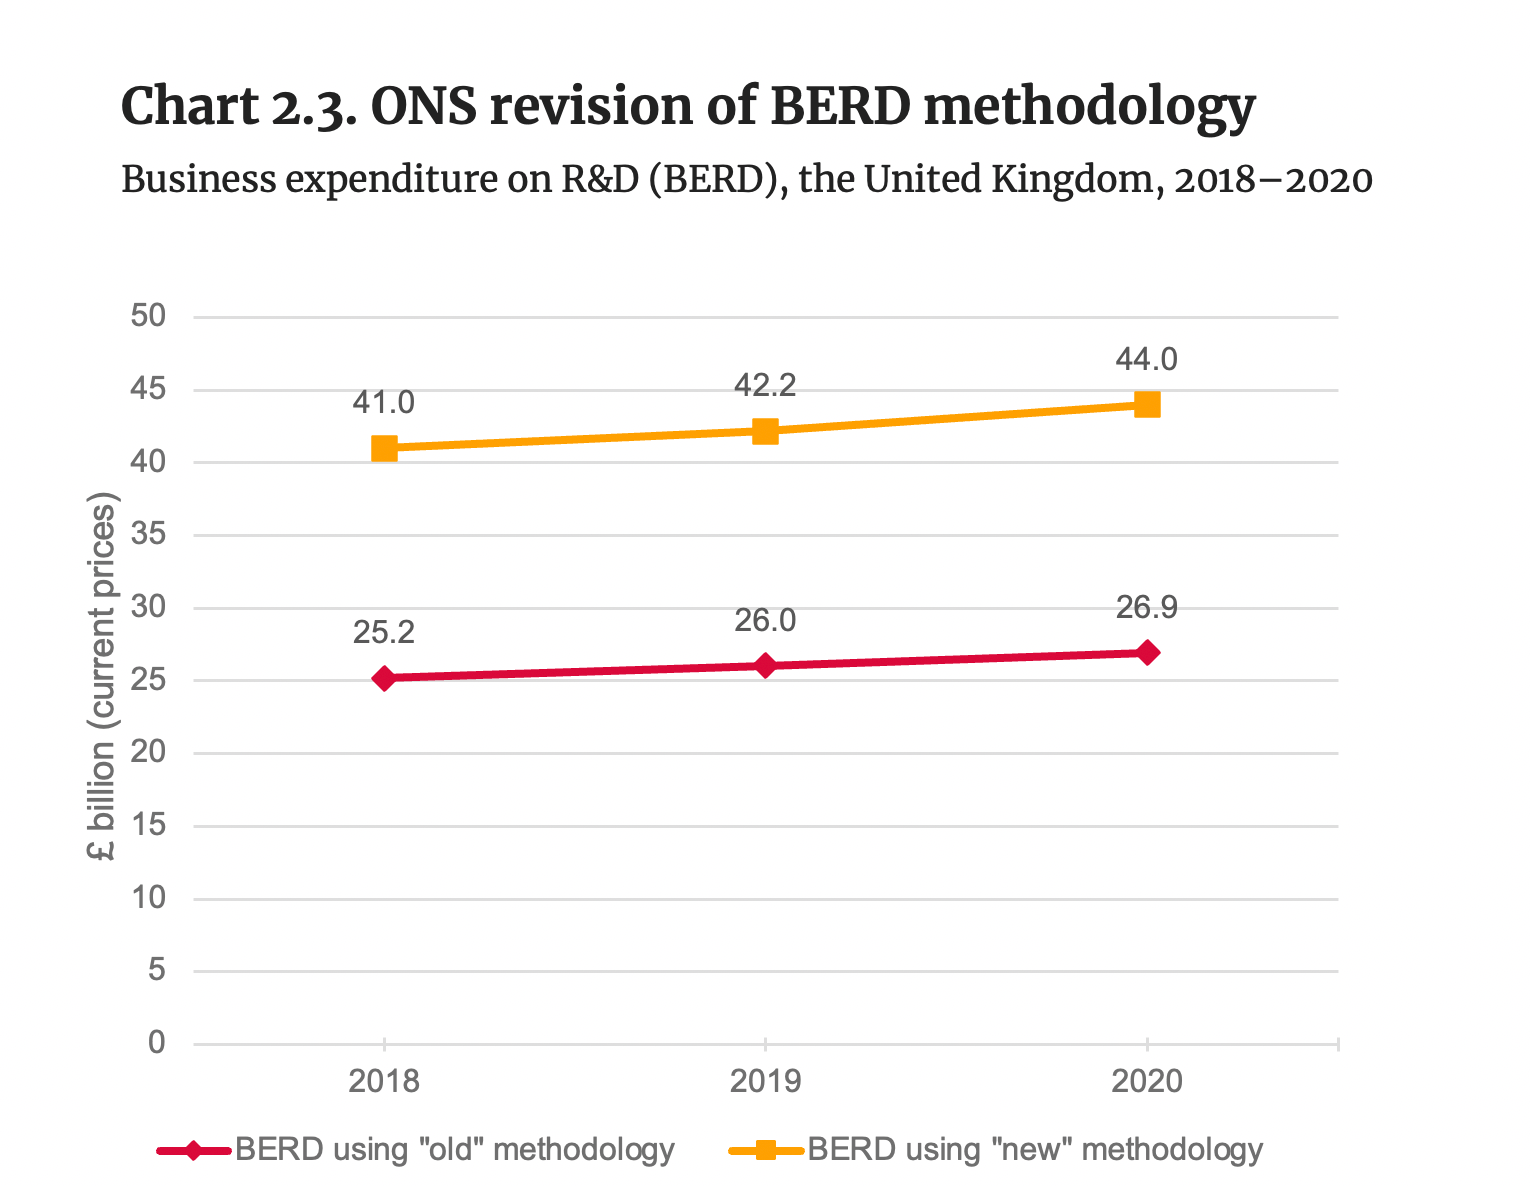
Source: ONS (2022). Business enterprise research and development (R&D), UK: 2021 (published on 22 November 2022); and ONS (2021). Research and development in UK Businesses, 2020 – Datasets.
- Using the new ONS methodology, expenditure on R&D performed by UK businesses in 2018, 2019 and 2020 was £15.8 billion, £16.1 billion and £17.1 billion (respectively) higher than previously published.
UK BERD by company employment size
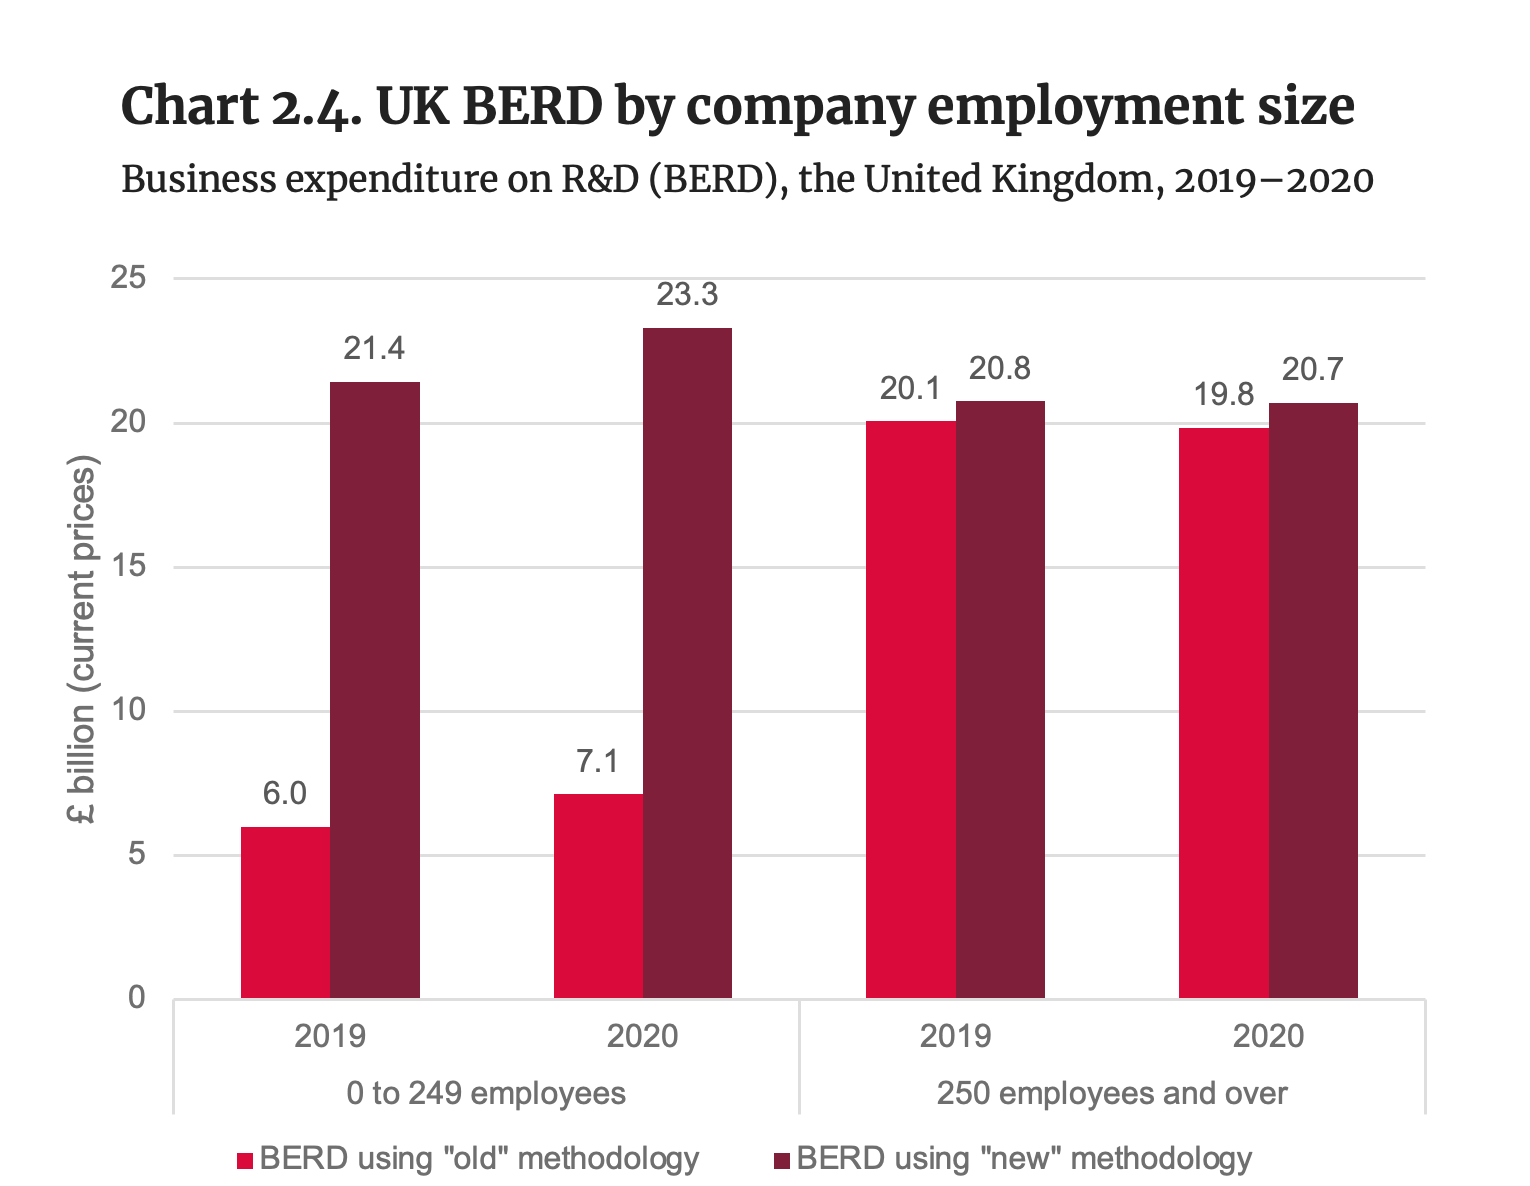
Source: ONS (2022). Business enterprise research and development (R&D), UK: 2021 (published on 22 November 2022); and ONS (2021). Research and development in UK Businesses, 2020 (Table b: Additional datasets).
- Small and medium enterprises (0–249 employees) account for more than 95% of the increase in R&D expenditure using the new ONS methodology.
UK BERD by broad product group
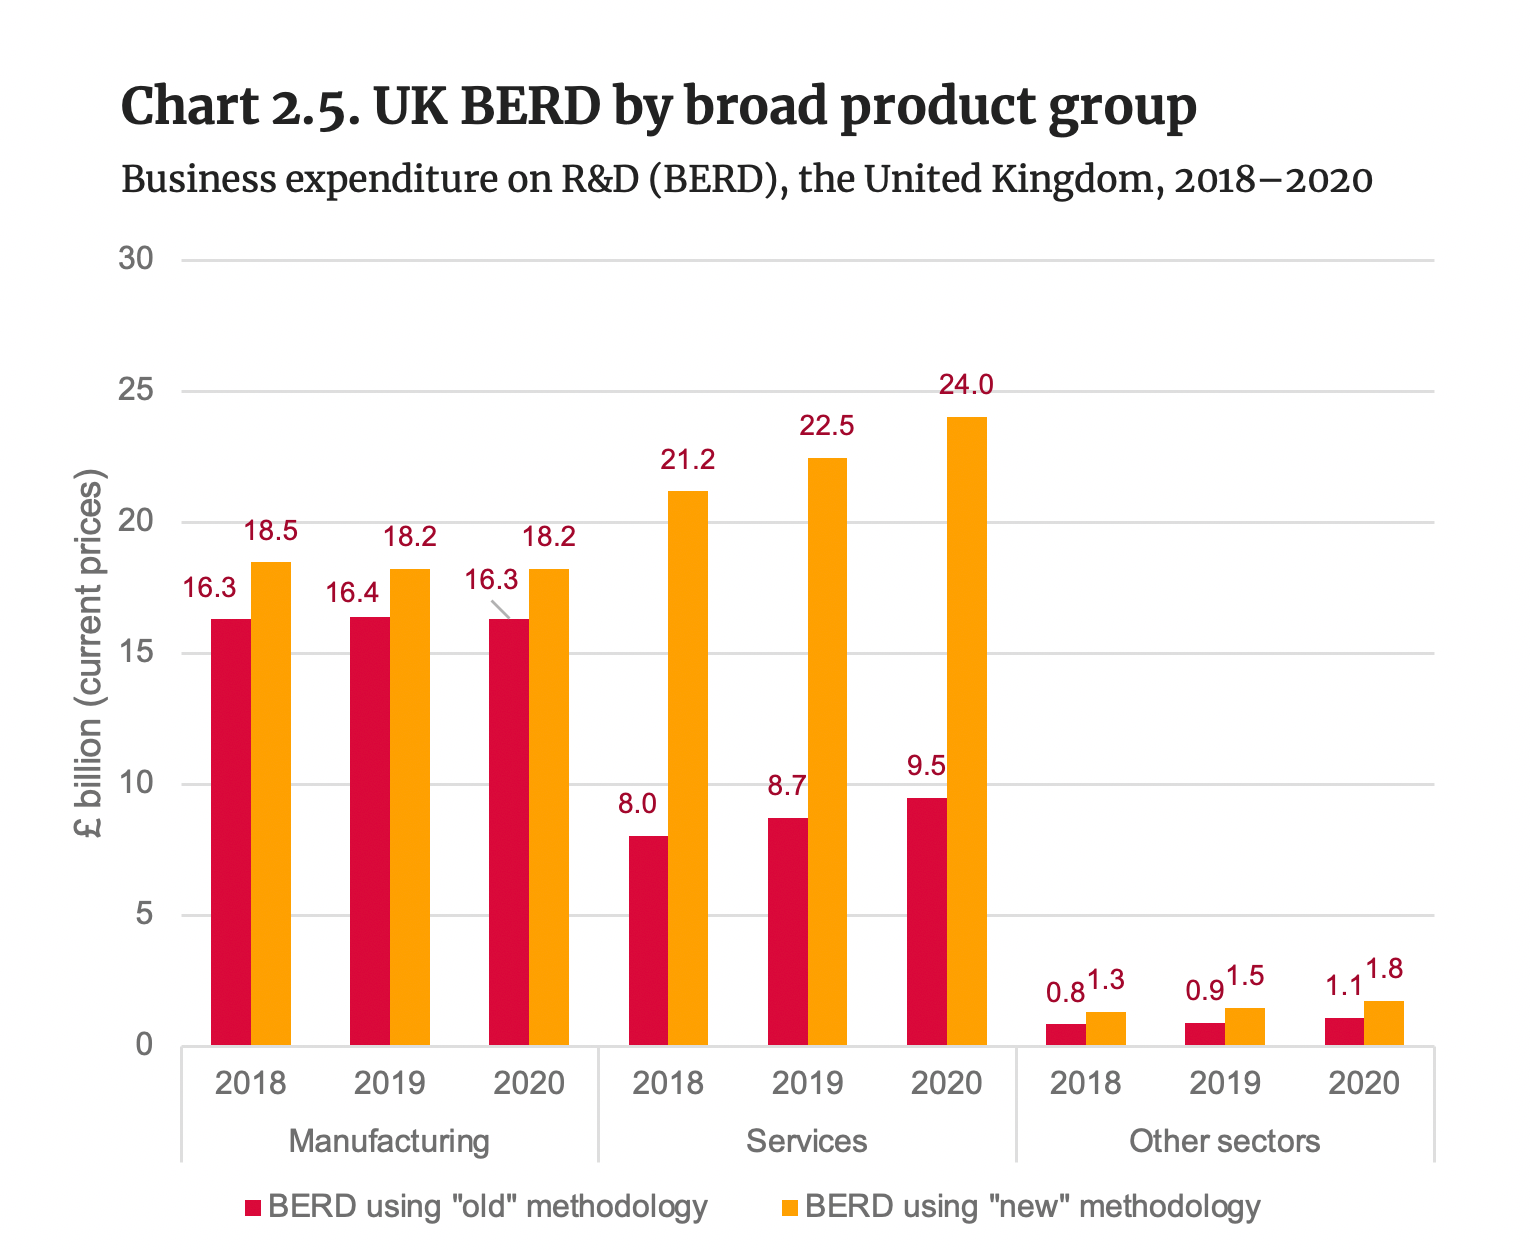
Note: Other sectors include: agriculture, hunting and forestry; fishing, extractive industries, electricity, gas and water supply; waste management; and construction.
Source: ONS (2022). Business enterprise research and development (R&D), UK: 2021 (published on 22 November 2022); and ONS (2021). Research and development in UK Businesses, 2020 – Datasets.
- Services account for 85% of the total increase in R&D expenditure under the ONS revised methodology for 2020, while manufacturing accounts for 11% and other sectors for 4%.
- Whereas R&D expenditure in services used to be around half of manufacturing R&D expenditure using the old methodology, it is roughly one-third higher under the new methodology.
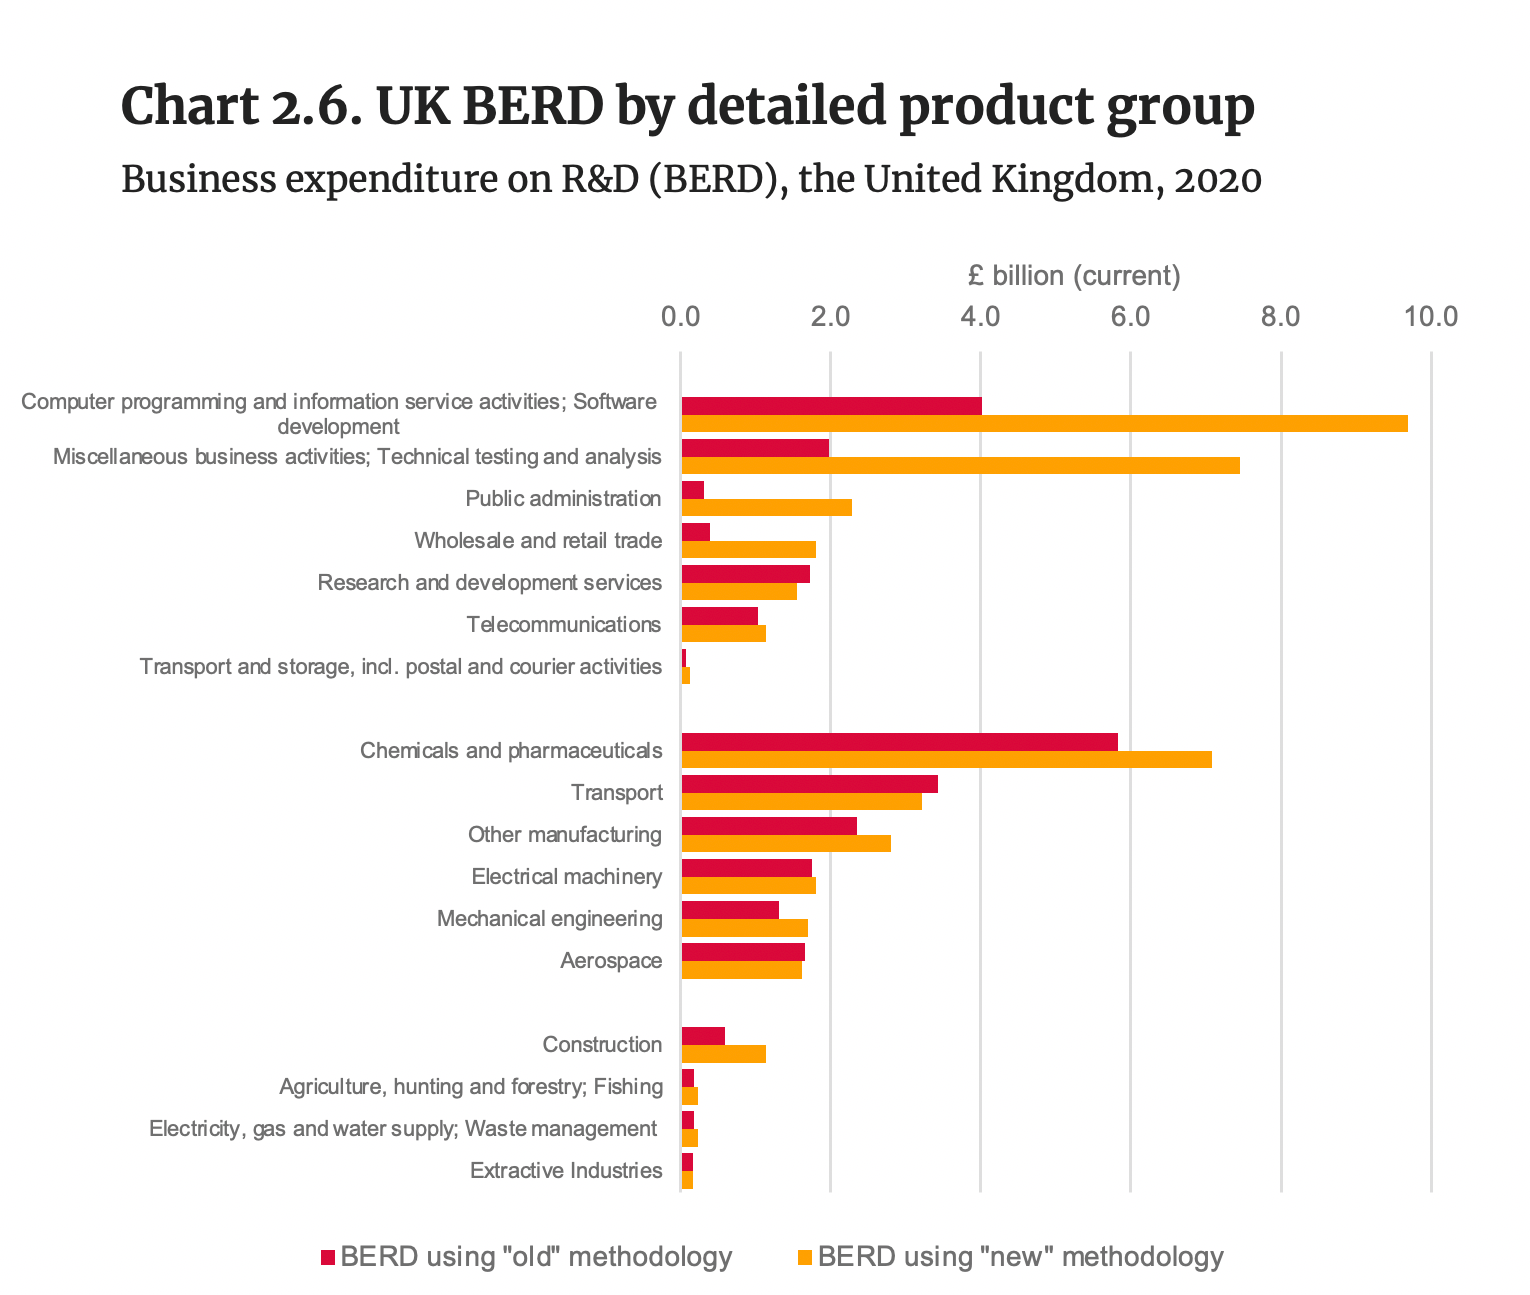
UK BERD by detailed product group
Source: ONS (2022). Business enterprise research and development (R&D), UK: 2021 (published on 22 November 2022); and ONS (2021). Research and development in UK Businesses, 2020 – Datasets.
- Four service product groups account for 85% of the £17.1 billion increase in R&D expenditure under the “new” ONS methodology for 2020:
- computer programming and information-service activities, software development;
- miscellaneous business activities, technical testing and analysis;
- public administration; and
- wholesale and retail trade.
UK BERD by Standard Industry Classification
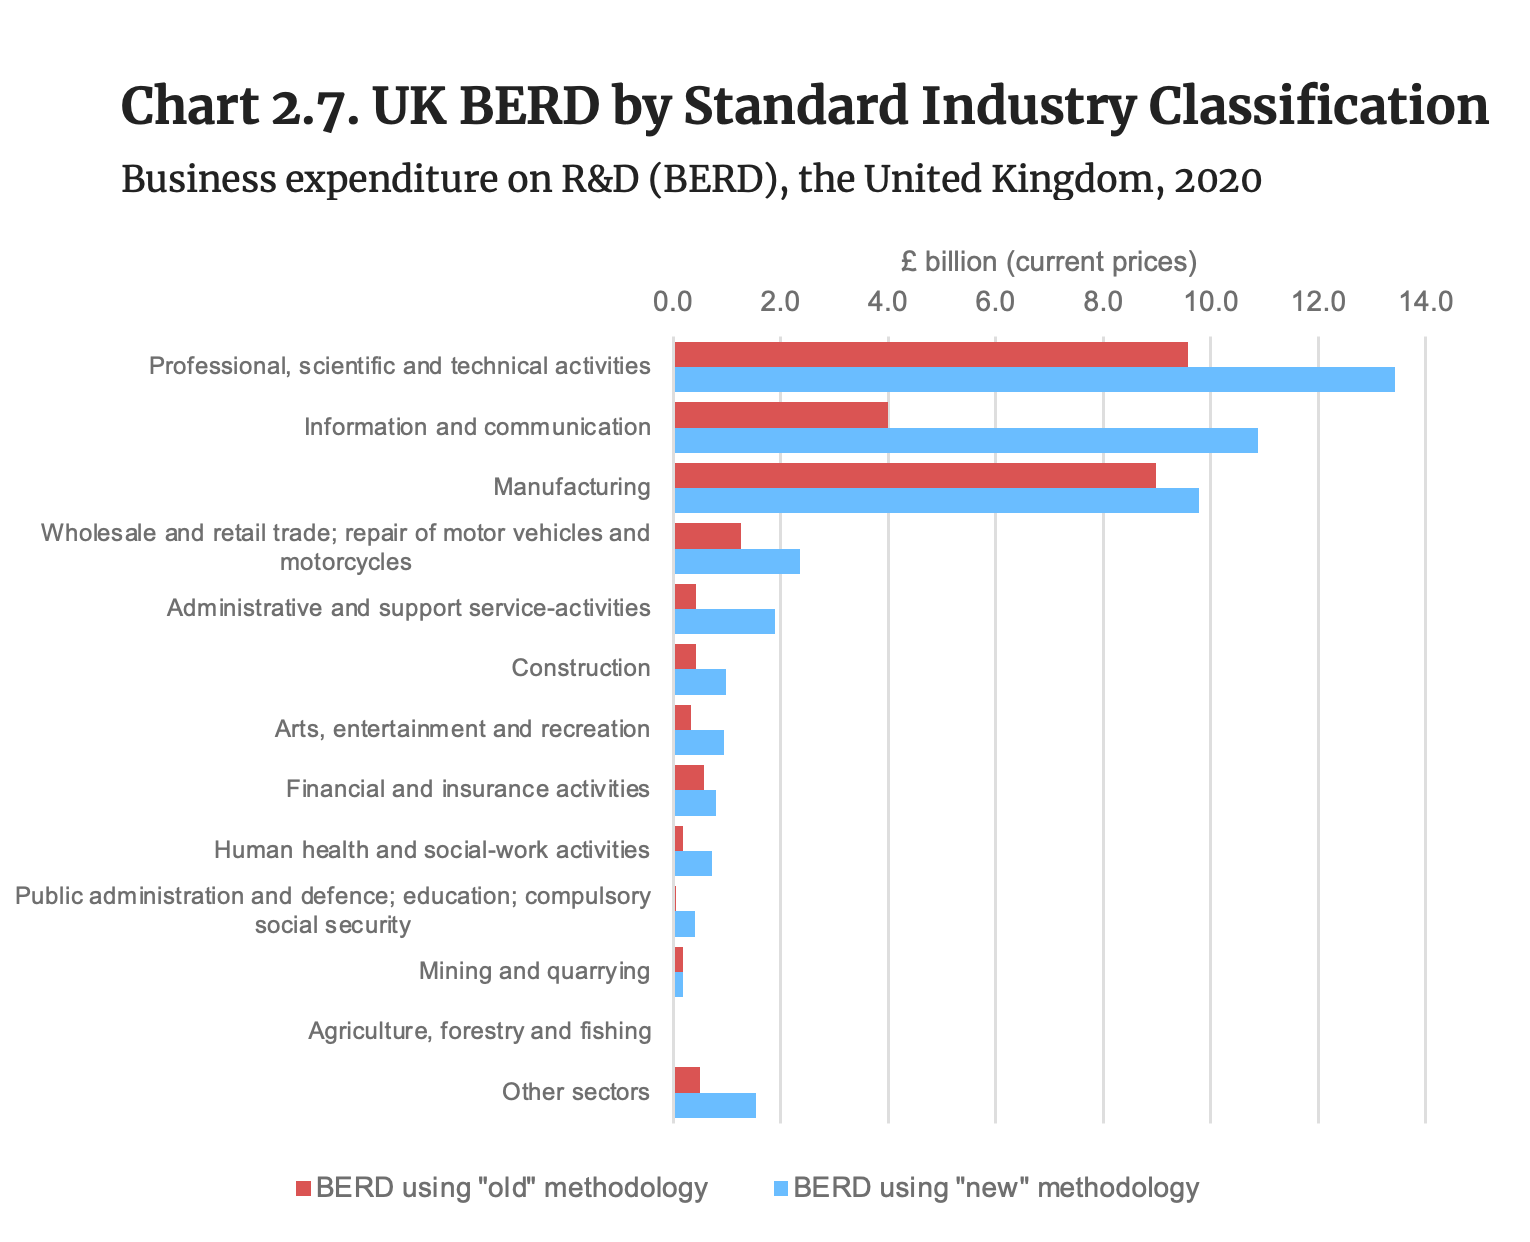
Note: Other sectors include: accommodation and food-service activities; real-estate activities; water supply, sewerage, waste management and remediation activities; transportation and storage; electricity, gas, steam and air conditioning supply; other service activities; activities of households as employers and of extraterritorial organisations and bodies.
Source: ONS (2022). Business enterprise research and development (R&D), UK: 2021 (published on 22 November 2022); and ONS (2021). Research and development in UK Businesses, 2020 (Table b: Additional datasets).
- Two sectors explain over 60% of the increase in business R&D expenditure under the “new” methodology:
- Information and communication activities account for 39% of the increase (£6.9 billion)
- Professional, scientific and technical activities account for 22% of the increase (£3.9 billion).
Manufacturing R&D: international comparison
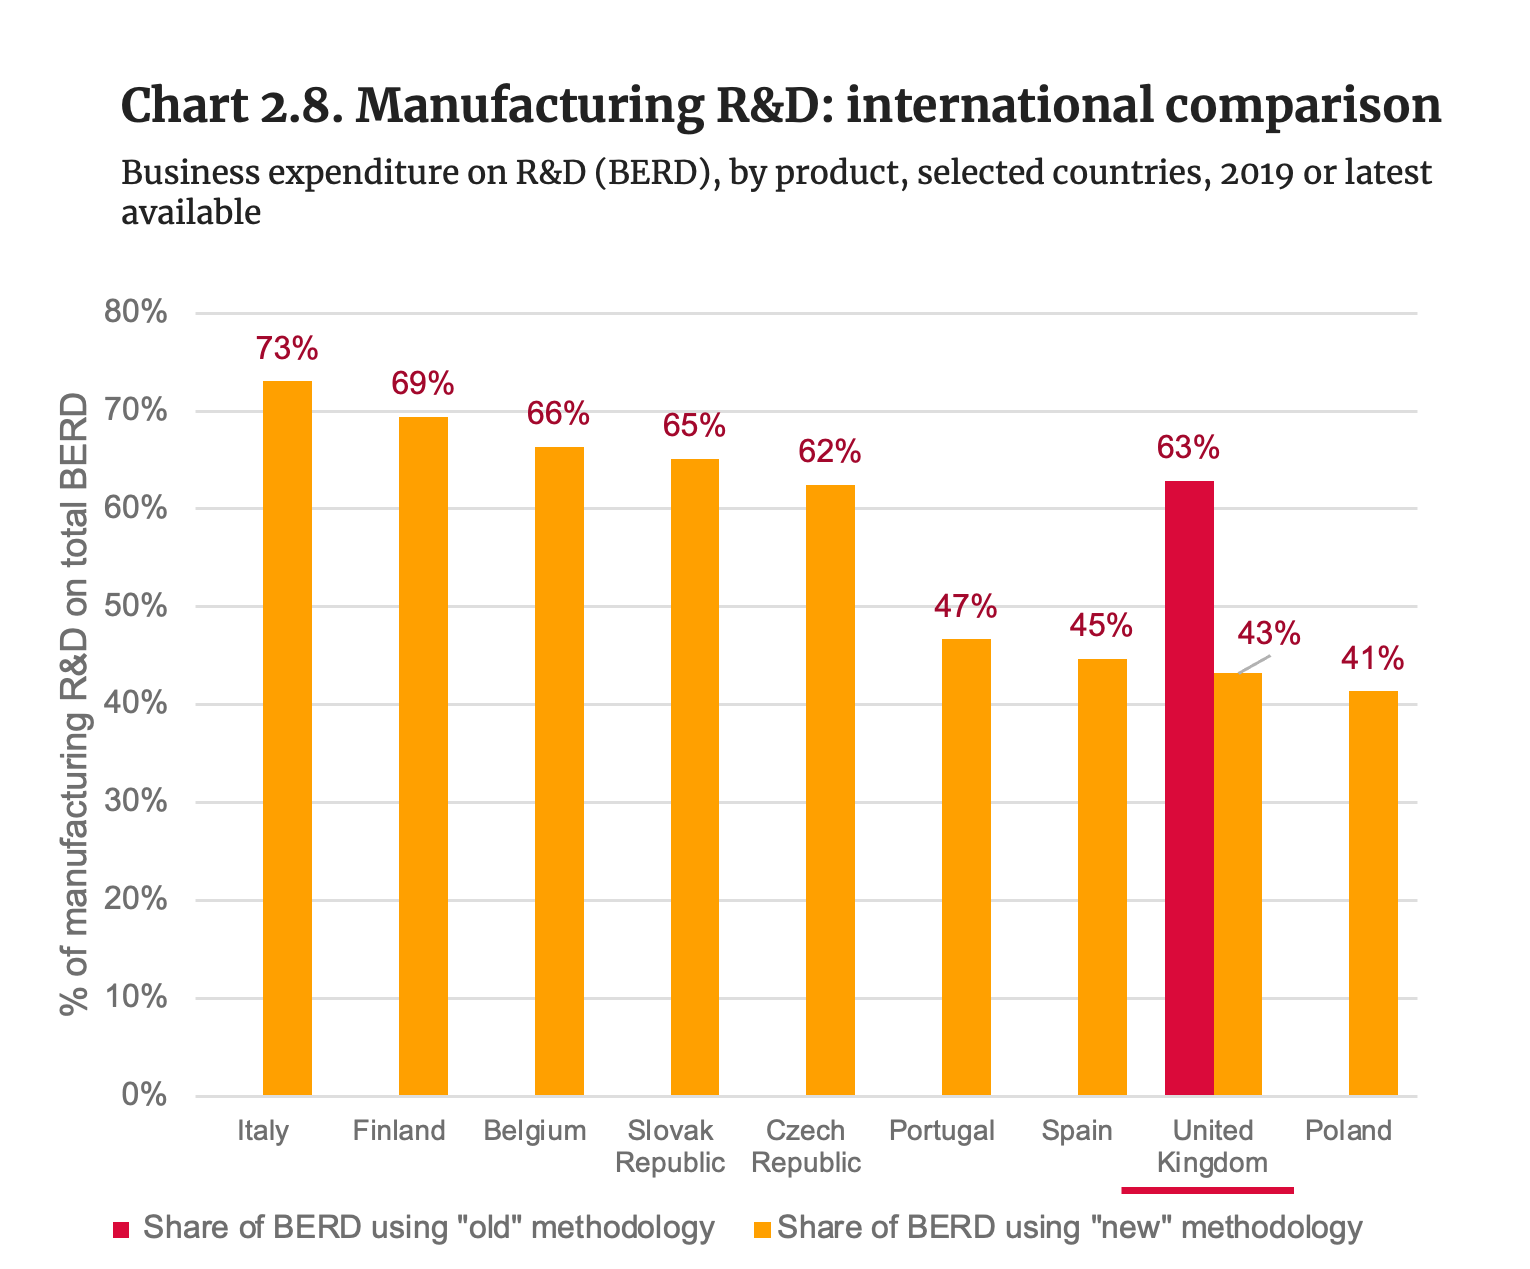
Note: Data for Italy, Poland, and Spain refer to 2018.
Source: OECD (2022). Business enterprise R&D expenditure by industry – Dataset; ONS (2022). Business enterprise research and development (R&D), UK: 2021 (published on 22 November 2022); and ONS (2021). Research and development in UK Businesses, 2020 (Table b: Additional datasets).
- Following ONS revisions of methodology to estimate R&D conducted by businesses in the UK, manufacturing is not anymore the main contributor to business R&D performed in the country.
- In 2019, the contribution of manufacturing to total business R&D conducted in the UK was 43%, equivalent to 20 percentage points below what was previously published.
Government expedniture on R&D
Source: OECD (2022). Main Science and Technology Indicators.
- The recent methodological revisions have not impacted the estimate of the UK government’s spend on R&D.[1]
- In 2019 UK government expenditure on R&D as a share of GDP was 0.12%, well below the OECD average of 0.24%.
Note: [1] ONS (2022). Gross domestic expenditure on research and development, UK: 2020 (published on 22 November 2022). The ONS has indicated that official GOVERD figures will be published by the end of 2023.
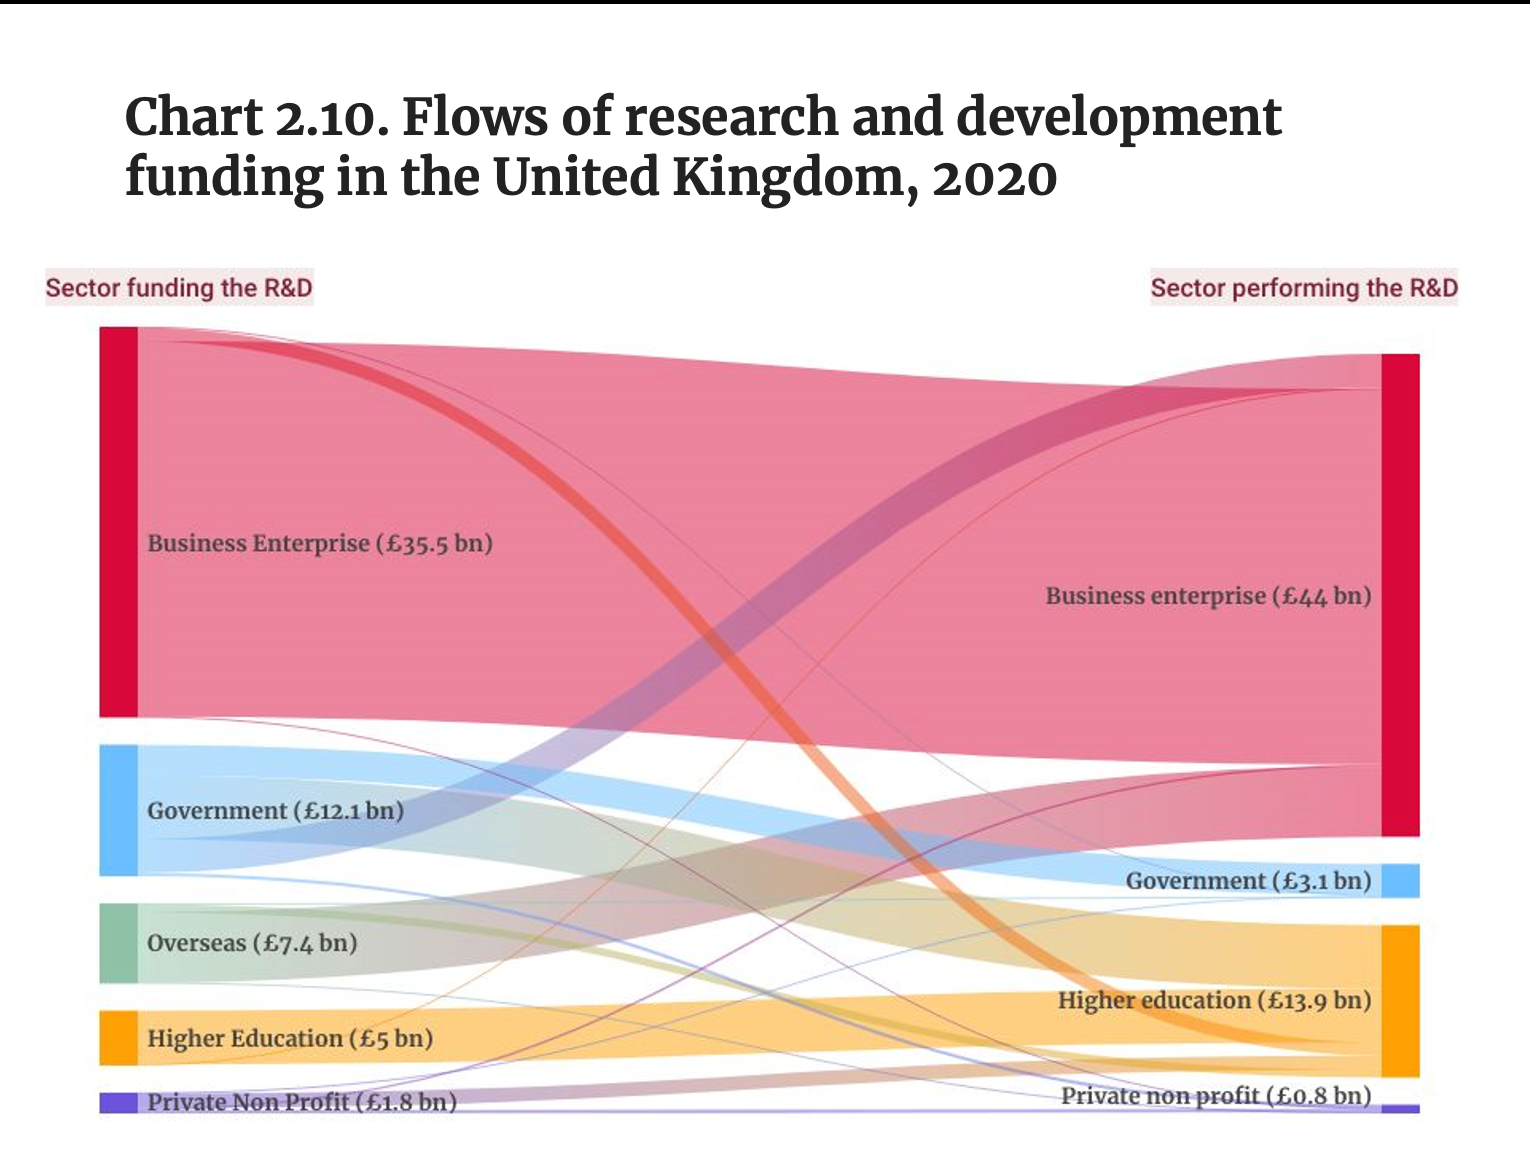
Flows of research and development funding in the United Kingdom, 2020
Note: The chart is based on the ONS revised methodology to estimate research and development expenditure in the UK introduced in November 2022; government includes government, UK Research and Innovation and Higher Education Funding Councils.
Source: ONS (2022). UK gross domestic expenditure on research and development (R&D), 2020, published on 22 November 2022.
- In 2020 the business sector performed 71.2% (£44 billion) of the total R&D in the UK, based on the ONS revised methodology to estimate R&D expenditure.
- In the UK non-business R&D is concentrated in the higher education sector (22.5%), while the UK government performs only 5% of total R&D.
💡 Related insight
According to Sir Paul Nurse’s Independent Review of the UK’s Research, Development and Innovation Organisational Landscape, many factors explain the concentration of non-business R&D in the higher education in the UK, but a major reason is “past policy choices by government to channel R&D funding through universities, rather than a wider set of Government funded Research Performing Organisations”. [1]
Note: [1] Nurse P. (2023, p. 37). Independent Review of the Research, Development and Innovation Organisational Landscape – Final Report and Recommendations.
Top R&D-investing companies in the world
Source: European Commission (2022). The 2022 EU Industrial R&D Investment Scoreboard.
- A total of 95 of the world’s 2,500 top R&D-investing companies are headquartered in the UK, behind the US (822), China (678), Japan (233) and Germany (114). [1]
- Together, the US and China’s headquartered firms account for 60% of the world’s top 2,500 R&D-investing companies.
- Pharmaceuticals and biotechnology and software and computer service firms account for 19.5% and 18.3%, respectively, of the total R&D expenditure conducted by the 2,500 top R&D-investing companies in 2021. [2]
Note: [1] The 2022 EU Industrial R&D Investment Scoreboard provides economic and financial information on the world’s top 2,500 firms investing in R&D. These companies have headquarters in 41 countries and represented 86.3% of the world’s expenditure in R&D funded by the business sector in 2021. See European Commission (2022). The 2022 EU Industrial R&D Investment Scoreboard. [2] Industries are defined according to the Industry Classification Benchmark (ICB) FTSE International.
Top 100 companies investing in R&D
Note: Others include: Switzerland and France (two companies each); Finland, Sweden, India, Ireland, Denmark (one company each).
Source: European Commission (2022). The 2022 EU Industrial R&D Investment Scoreboard.
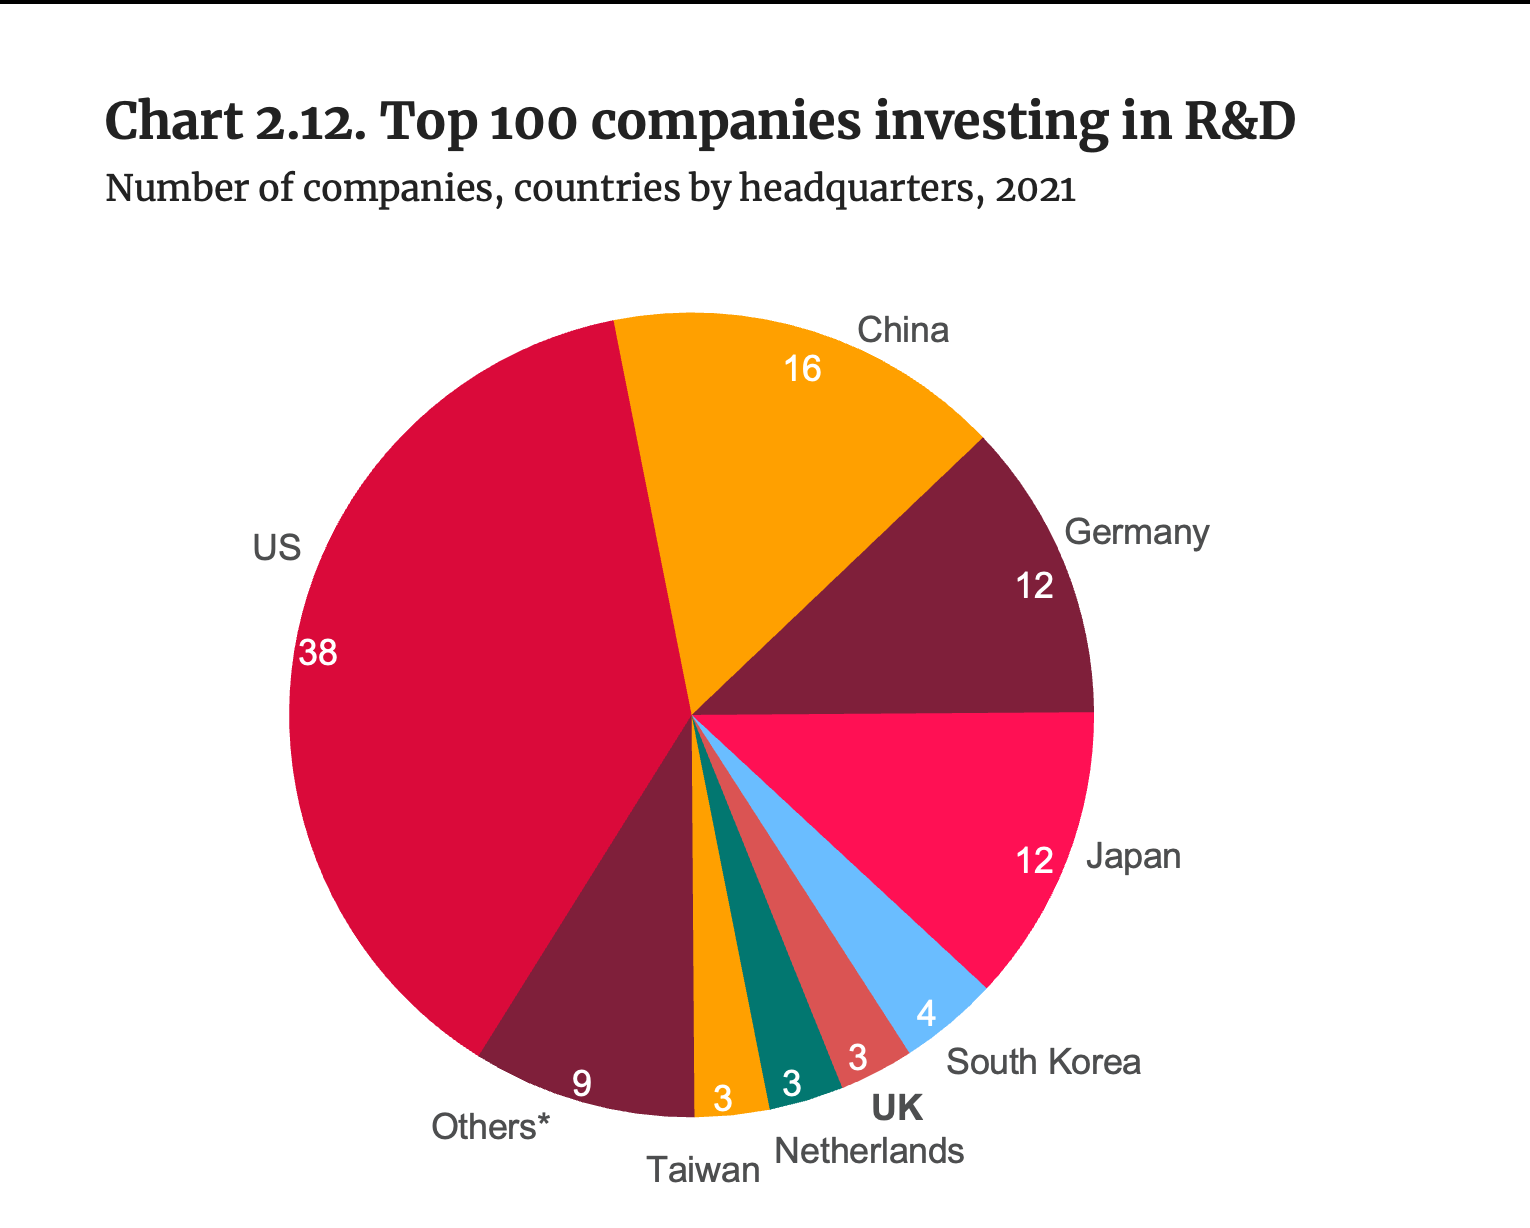
- The UK hosted only 3 of the top 100 R&D-investing firms in the world in 2021.[1]
- Together, the US and China hosted more than half of these firms.
💡 Related insight
In 2021 the top three R&D-investing companies in the world were based in the US, namely, Alphabet (the parent company of Google), Meta (formerly Facebook) and Microsoft, which that year invested €27.9 billion, €21.8 billion and €21.6 billion, respectively.
The top three R&D-investing firms headquartered in the UK in 2021 were AstraZeneca and GSK (pharmaceuticals and biotechnology) and HSBC (banking).
Note: [1] R&D-investing companies are the 2,500 firms that invested the largest sums in R&D worldwide in 2021, as defined in the 2022 EU Industrial R&D Investment Scoreboard. Those companies have headquarters in 41 countries and represented 86.3% of the world’s expenditure in R&D funded by the business sector in 2021.
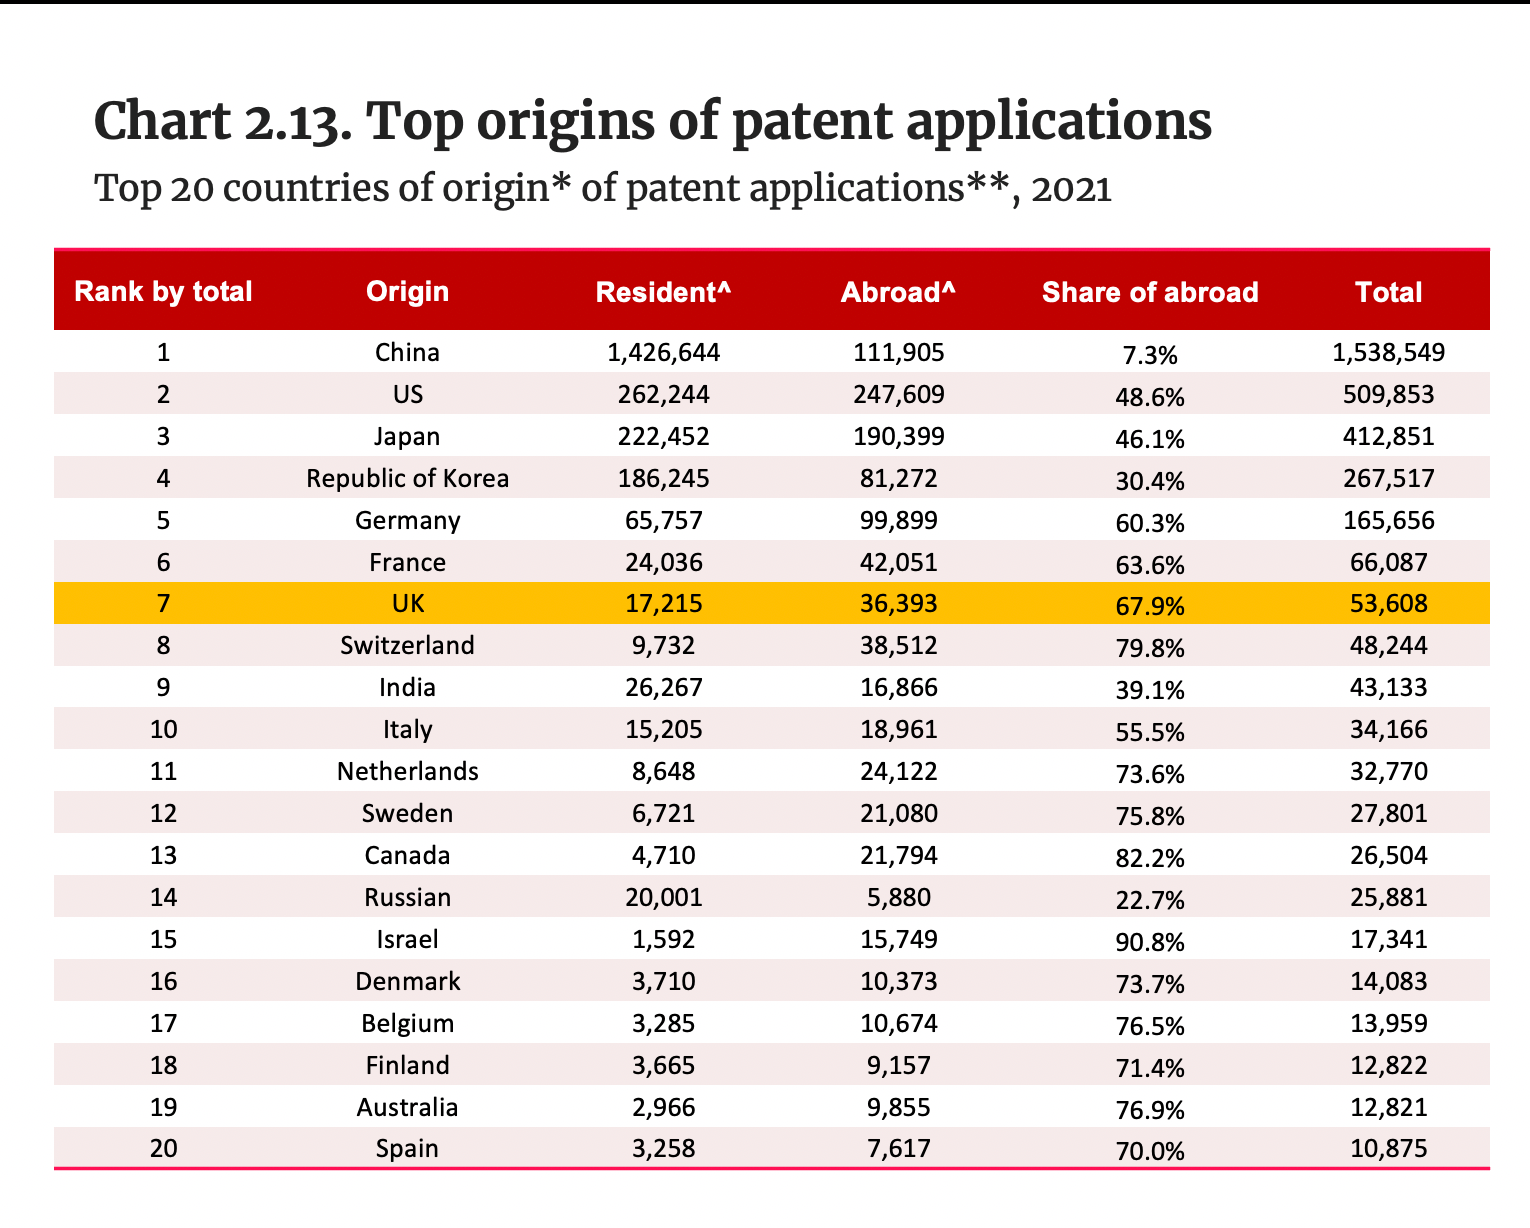
Top origins of patent applications
Source: World Intellectual Property Office (September 2022). World Intellectual Property Indicators 2022
- In 2021 UK-based applicants filed 53,608 patents globally, behind Germany (165,656 applications) and France (66,087 applications) but more than Switzerland, Italy, the Netherlands and Sweden.
The top five origins in 2021 were China, the United States, Japan, the Republic of Korea and Germany. These have been the top five origins for almost 20 years. - While China is the top origin of patent applications in the world, its share of applications filed abroad is much lower than other top origins, at 7.3%.
Note:
^Applications filed by applicants at a national or regional office (resident
applications) or at a foreign office (applications abroad) are referred to as origin data. Here, patent statistics based on the origin of residence of the first named applicant are reported in order to complement the picture of patent activity worldwide.
*Origin: the country of residence (or nationality, in the absence of a valid residence) of the first-named applicant of an IP application. Country of origin is used to determine the origin of the IP application.
**Applications filed at regional offices (e.g. European Patent Office (EPO)) are considered equivalent to multiple applications in the relevant member states. Hence, the data for patent applications in this table is based on equivalent, not absolute, counts. For example, because the UK is one of EPO’s member states, the resident application data for the UK (17,215) is the sum of the number of patent applications filed with the UK’s Intellectual Property Office by the UK resident patent applicants (11,592) and the number of patent applications filed with EPO by the UK resident patent applicants (5,623).
Top 100 patent applicants at USPTO and EPO
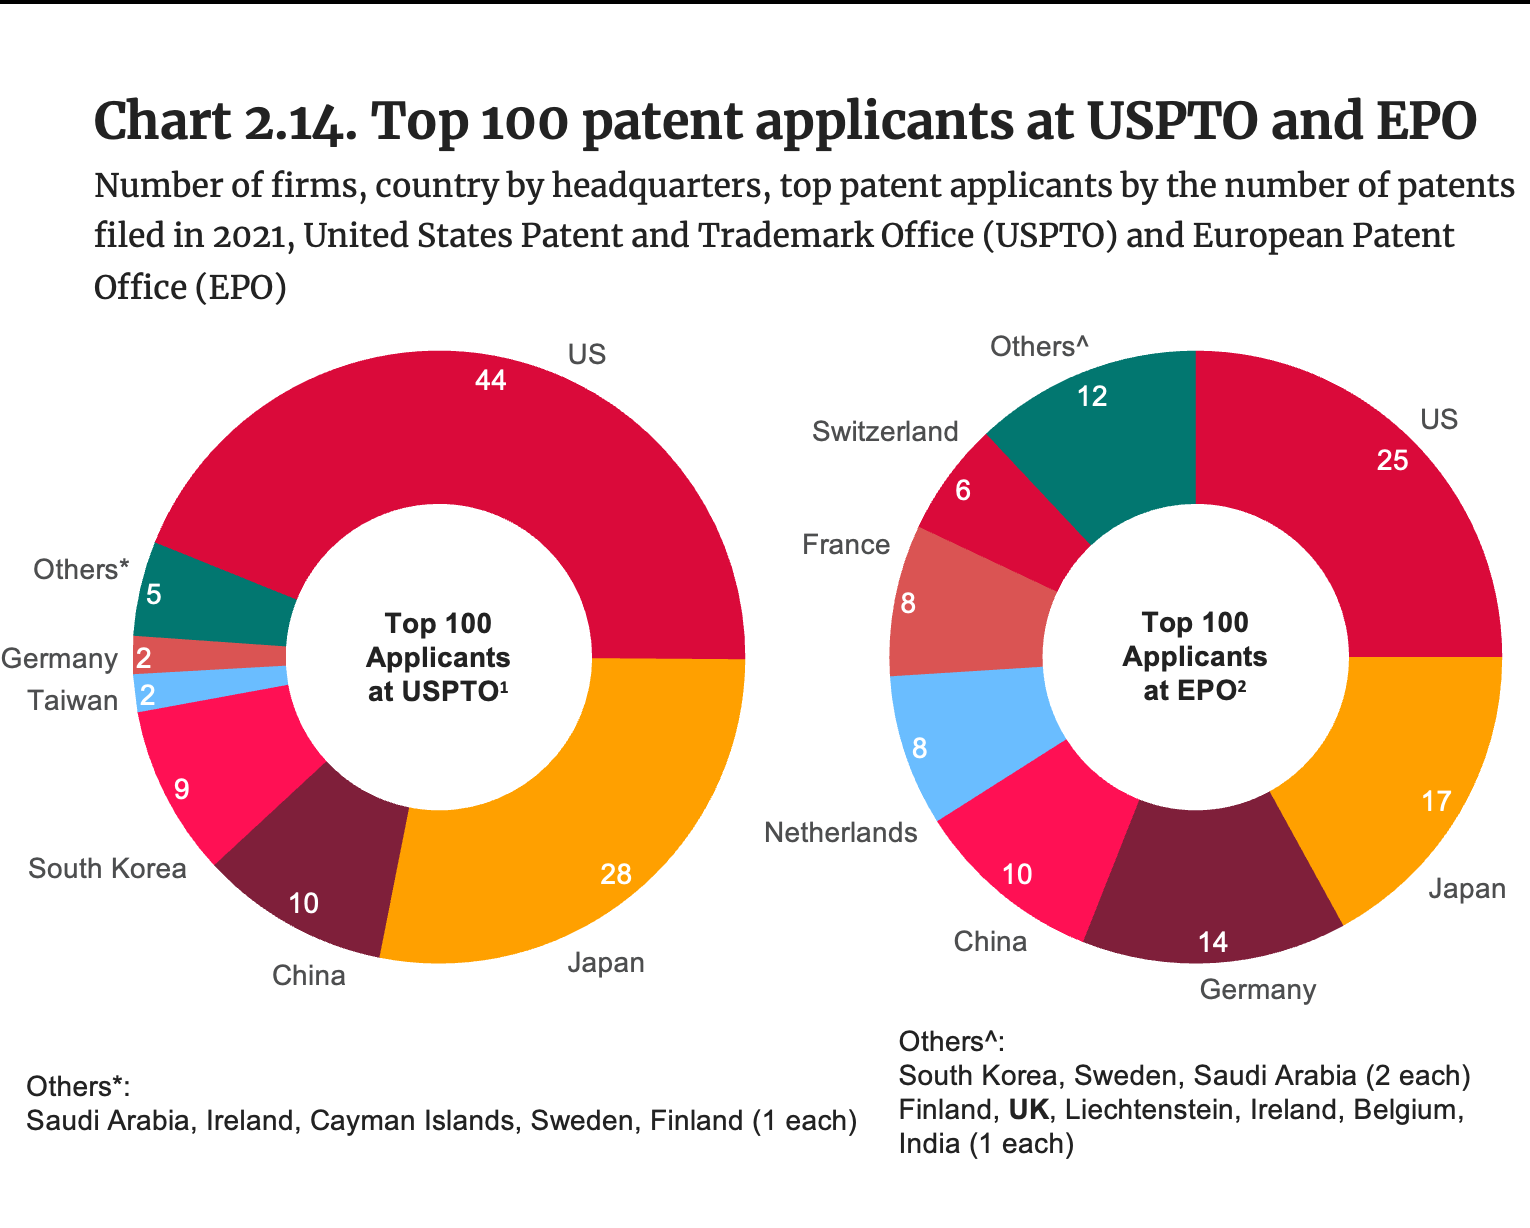 Source: European Patent Office (cut-off date for data: 24 Jan 2022), Top 100 applicants 2021; the patent data for USPTO was retrieved from Lens.org on 22 February 2023.
- In 2021 there were no UK-headquartered applicants among the top 100 applicants at the United States Patent and Trademark Office (USPTO); and only 1 among the top 100 applicants at the European Patent Office (EPO).
Note:
USPTO
- The ranking of top 100 applicants at USPTO in 2021 is based on the number of patent applications filed with USPTO in 2021 (first-named applicant principle).
The applicants in this ranking are not consolidated. - If a subsidiary company is located in a different country from its parent company, it is separately allocated to the countries where its headquarters are.
- The countries refer to the country of residence of the headquarters.
EPO
- The ranking of top 100 consolidated applicants at EPO in 2021 (first-named applicant principle).
- The EPO ranking is based on European patent applications filed with EPO, which include direct European applications and international (PCT) applications that entered the European phase during the reporting period.
- Applications by identifiable subsidiaries, not necessarily located in the same country, are allocated to the consolidated applicants.
- The countries refer to the country of residence of the headquarters.
Patent application in 2021
- There is an 18-month publication lag between the earliest filing date of a patent and its publication date. However, the patent can be published earlier upon request from the applicant.
- There might be some patents that were filed in 2021 but which have not been published by the cut-off date for data extraction.
Top 10 UK patent applicants at USPTO and EPO
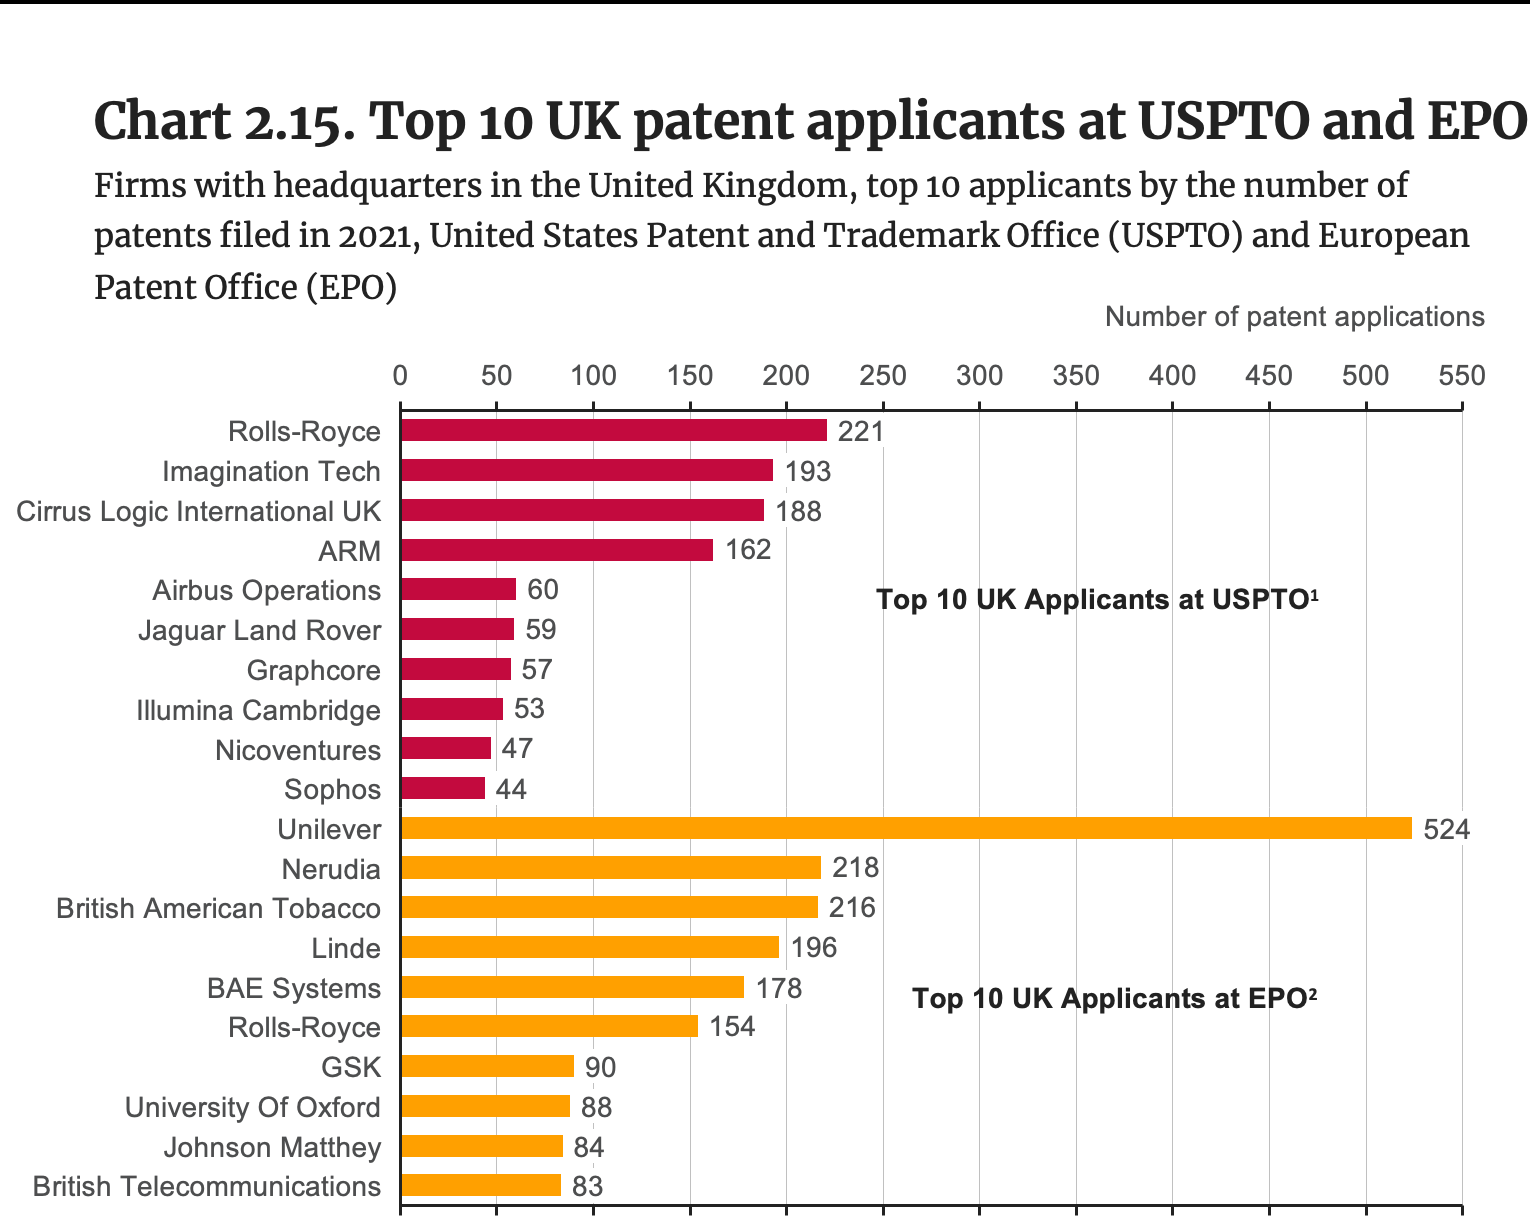
Source: European Patent Office (cut-off date for data: 1 February 2022), Key data for selected countries United Kingdom 2021. The patent data for USPTO was retrieved from Lens.org on 22 February 2023.
- Rolls-Royce (aerospace) was the UK-based company that filed the most patents with the United States Patent and Trademark Office (USPTO) in 2021, followed by Imagination Tech (Semiconductor), Cirrus Logic Int. UK (Semiconductor) and ARM (semiconductors).
- Unilever (consumer goods) was the UK-based company that submitted the most patent applications with the European Patent Office (EPO) in 2021, way ahead of Nerudia (tobacco) and British American Tobacco (tobacco).
- Rolls-Royce was the only company to appear in both rankings, filing 67 more patents with USPTO compared to EPO.
- The University of Oxford was the only research institute across both the USPTO and EPO rankings.
Note:
USPTO
- The ranking of top 100 applicants at USPTO in 2021 is based on the number of patent applications filed with USPTO in 2021 (first-named applicant principle).
- The applicants in this ranking are not consolidated.
If a subsidiary company is located in a different country from its parent company, it is separately allocated to the countries where its headquarters are. - The countries refer to the country of residence of the headquarters
EPO
- The ranking of top 100 consolidated applicants at EPO in 2021 (first-named applicant principle).
- The EPO ranking is based on European patent applications filed with EPO, which include direct European applications and international (PCT) applications that entered the European phase during the reporting period.
- Applications by identifiable subsidiaries, not necessarily located in the same country, are allocated to the consolidated applicants.
The countries refer to the country of residence of the headquarters.
Patent application in 2021
- There is an 18-month publication lag between the earliest filing date of a patent and its publication date. However, the patent can be published earlier upon request from the applicant.
- There might be some patents that were
Explainer: The “new” ONS methodology to calculate R&D expenditure in the United Kingdom (1/2)
- In November 2022, the Office for National Statistics (ONS) introduced a major revision to the methodology used to estimate R&D performed by businesses and the higher education sector.
- The rationale behind ONS methodological revisions of business R&D relies on the need to take into account R&D activities conducted by small and medium enterprises (SMEs), underestimated under the methodology that was previously employed.
- Discrepancies were found between ONS Business Enterprise Research and Development (BERD) statistics and HM Revenue and Customs (HMRC) research and development (R&D) statistics, which are based on a different population of companies and use different methodologies.
- The revisions introduced align ONS methodology to methodologies used by other countries, particularly with respect to the sampling method employed. [1] While HMRC R&D statistics are based on administrative data provided by both large companies and SMEs claiming R&D tax relief, the population of ONS BERD statistics is composed of large companies (with more than 250 employees) and a random sample of SMEs. Therefore, under ONS BERD statistics, many SMEs conducting R&D activities risk being under-represented. [2]
- The ONS also introduced methodological improvements to better capture the R&D performed by the higher education sector. Methods previously employed focused on assessing the flow of funding into higher education for R&D to be performed, but they were unable to capture the R&D actually performed (and funded) within the sector. Using a new methodology that also relies on a new data source – the Transparent Approach to Costing (TRAC) – the ONS is now also able to account for R&D performed within higher education and funded within the sector using its own funding sources. [3]
[1] ONS (2022). Options for transformation of business enterprise research and development statistics (published on 22 November 2022).
[2] ONS (2022). Comparison of ONS business enterprise research and development statistics with HMRC research and development tax credit statistics (published on 29 September 2022).
[3] ONS (2022). Gross domestic expenditure on research and development, UK: 2020 (published on 22 November 2022).
Explainer: The “new” ONS methodology to calculate R&D expenditure in the United Kingdom (2/2)
Source: ONS (2022). UK gross domestic expenditure on research and development (R&D), 2020, published on 22 November 2022; ONS (2021). UK gross domestic expenditure on research and development (R&D), 2019 (published on 4 August 2021).
- According to the OECD’s Frascati Manual that sets up the guidelines to collect and report R&D data, the gross domestic expenditure on R&D (GERD) is the total in-house expenditure on R&D performed in the national territory in a given time period.
- GERD measures the total domestic R&D performed by the following sectors:
- The business enterprise sector (BERD)
- The government sector (GOVERD)
- The higher education sector (HERD)
- The private non-profit sector (PNPRD)


