
Theme 4
Science and Engineering Workforce
Science and Engineering Workforce
Policy questions addressed in Theme 4
- Is the UK producing enough scientists and engineers?
- Is the UK government investing enough in technical and vocational education?
- How does this compare with other countries?
Key findings
The UK has relatively high shares of graduates in STEM disciplines, but the share of graduates in the STEM sub-discipline of engineering, manufacturing and construction remains relatively low
- In 2020 STEM (science, technology, engineering and mathematics) graduates in the UK accounted for 41% of total graduates, above countries such as France (35%), Canada (39%), and similar to the US.
- The share of graduates in engineering, manufacturing and construction in the UK, at 9%, is low compared with countries such as Germany (26%) and Korea (21%).
The UK higher education system has been continuously attracting international students who show a preference for non-science fields of study
- In 2020 the share of international students enrolled in tertiary education courses in the UK was 20.1%, against an OECD average of 10.1%.
- Between 2017/18 and 2021/22, the number of international students enrolled in the UK increased by 45%.
- For the academic year 2018/19, 61% of international students were enrolled in non-science subject courses.
The UK has a relatively low share of researchers working in the business sector, and women researchers are under-represented
- In 2020 the business sector in the UK employed 42% of researchers, below Korea (82%), Japan (75%) and the US (72%) but also below countries such as France (63%) and Germany (60%).
- In 2019 women accounted for 39% of total researchers, placing the UK in the top 10 of OECD countries.
- In the UK female graduates are under-represented in some STEM disciplines, particularly in engineering, manufacturing and construction.
Graduates by subject area
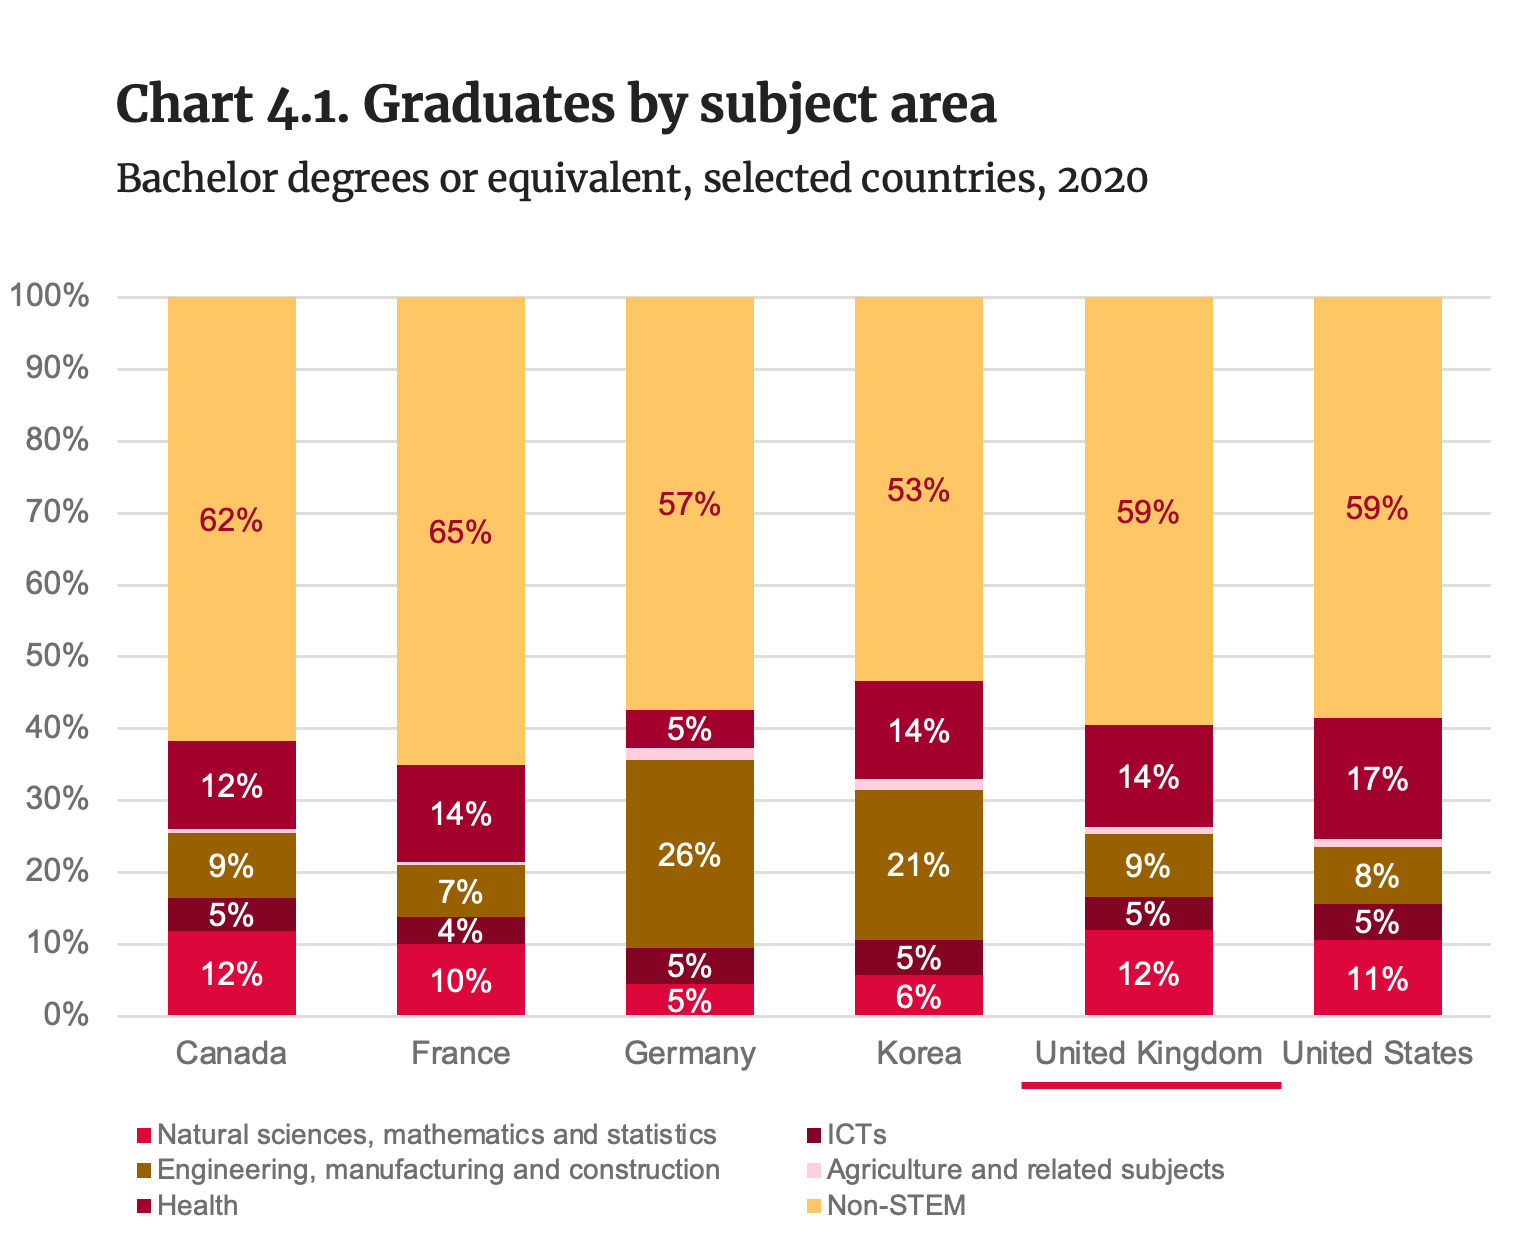
Note: Non-STEM subject areas include: arts and humanities; social sciences, journalism and information; business, administration and law; education; generic programmes and qualification; field unknown.
Source: OECD (2022). Education at a Glance database.
- The UK has historically had relatively high levels of tertiary education attainment. In 2021 the level of tertiary education attainment in the UK was 50.1%, well above the OECD average (39.7%). [1]
- In 2020 STEM (science, technology, engineering, and mathematics) graduates in the UK accounted for 41% of total graduates. The value was above comparator countries such as France (35%), Canada (39%), and similar to the US (41%).
- The share of graduates in engineering, manufacturing and construction remains relatively low in the UK, at 9%, especially compared to countries such as Germany (26%) and Korea (21%).
Note: [1] Tertiary education attainment is measured as the percentage of the population aged 25–64, in the same age group, with a Bachelor’s degree or above. Source: OECD (2023). Adult education level (indicator).
Women in STEM tertiary education
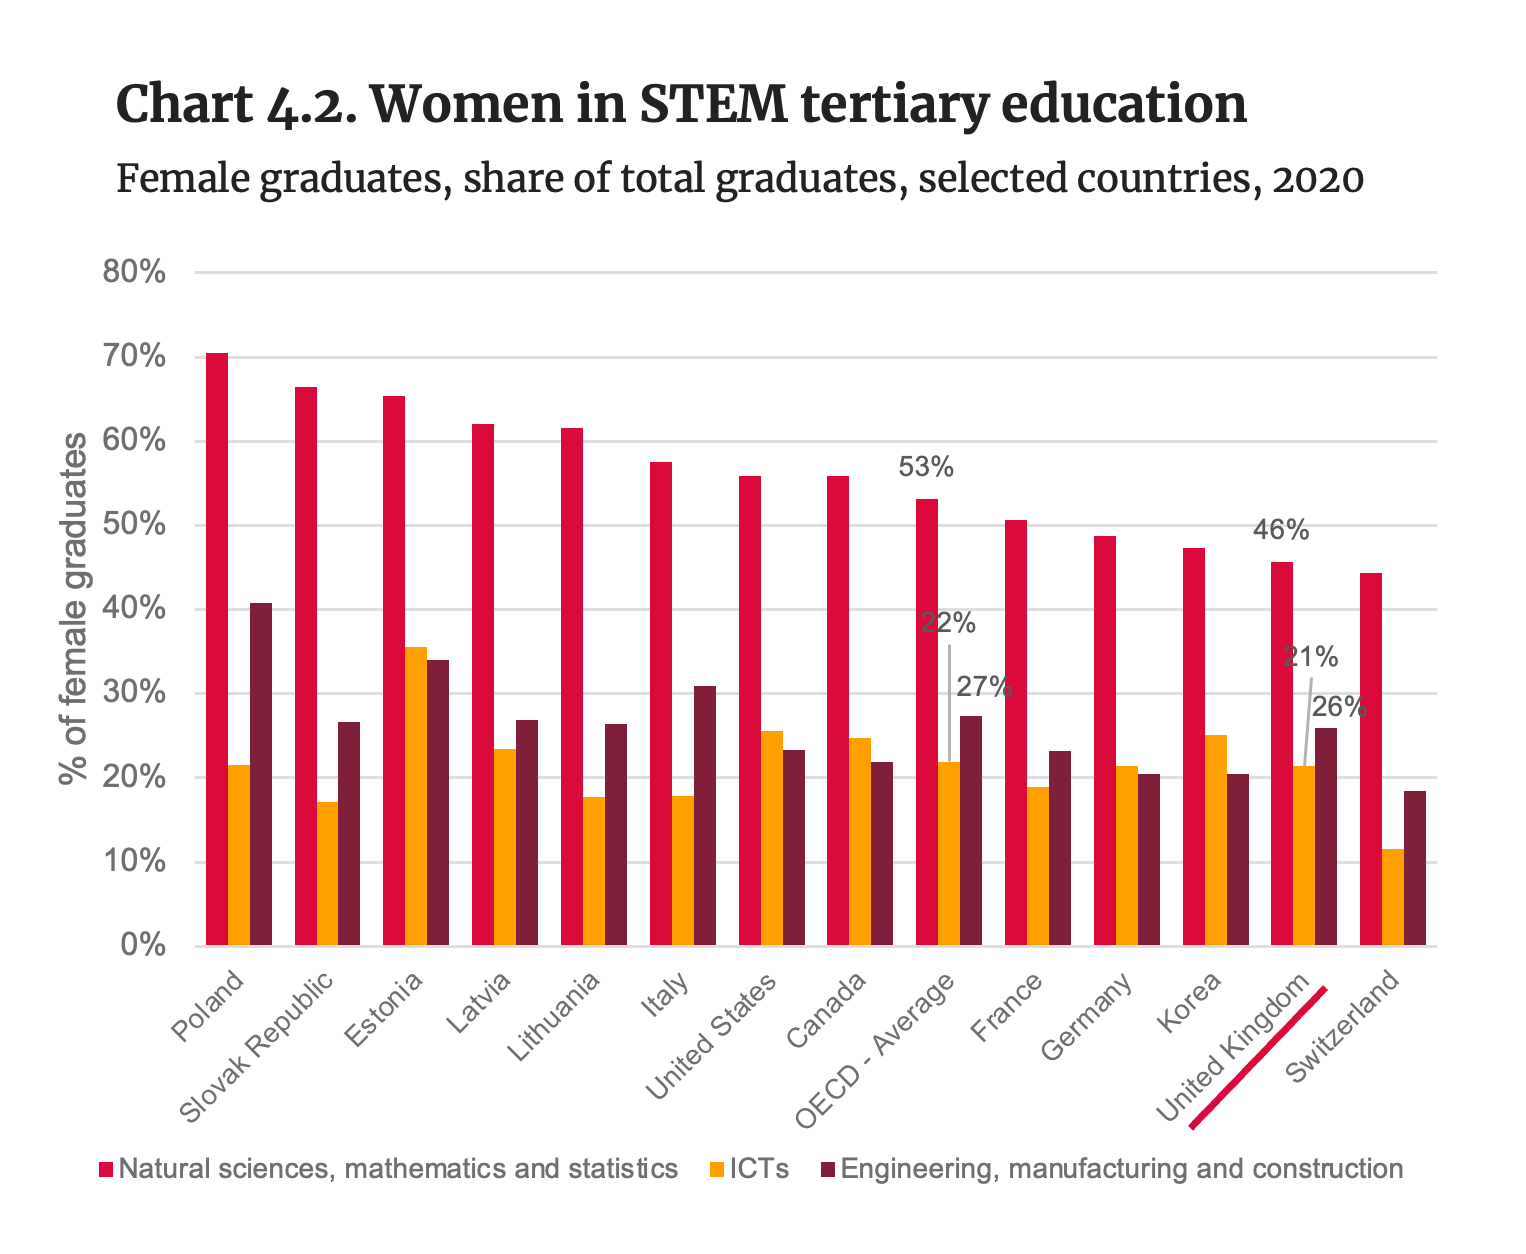
Source: OECD (2022). Education at a Glance database.
- While women have tertiary education attainment levels that are higher than men, they are usually under-represented in some STEM disciplines, in both the UK and most OECD countries. [1]
- In 2020, in the UK, women represented 26% of graduates in engineering, manufacturing and construction degrees, against the 27% OECD average. In ICT disciplines, women represented 21% of graduates, against the OECD average of 22%.
- Natural sciences, mathematics and statistics are the fields of study that have higher shares of female graduates among STEM disciplines. In 2020 the share of female graduates among natural sciences, mathematics and statistics graduates in the UK was 46%, below the OECD average (53%).
Note: [1] Engineering UK (2022). Trends in the engineering workforce between 2010 and 2021.
International students in the UK
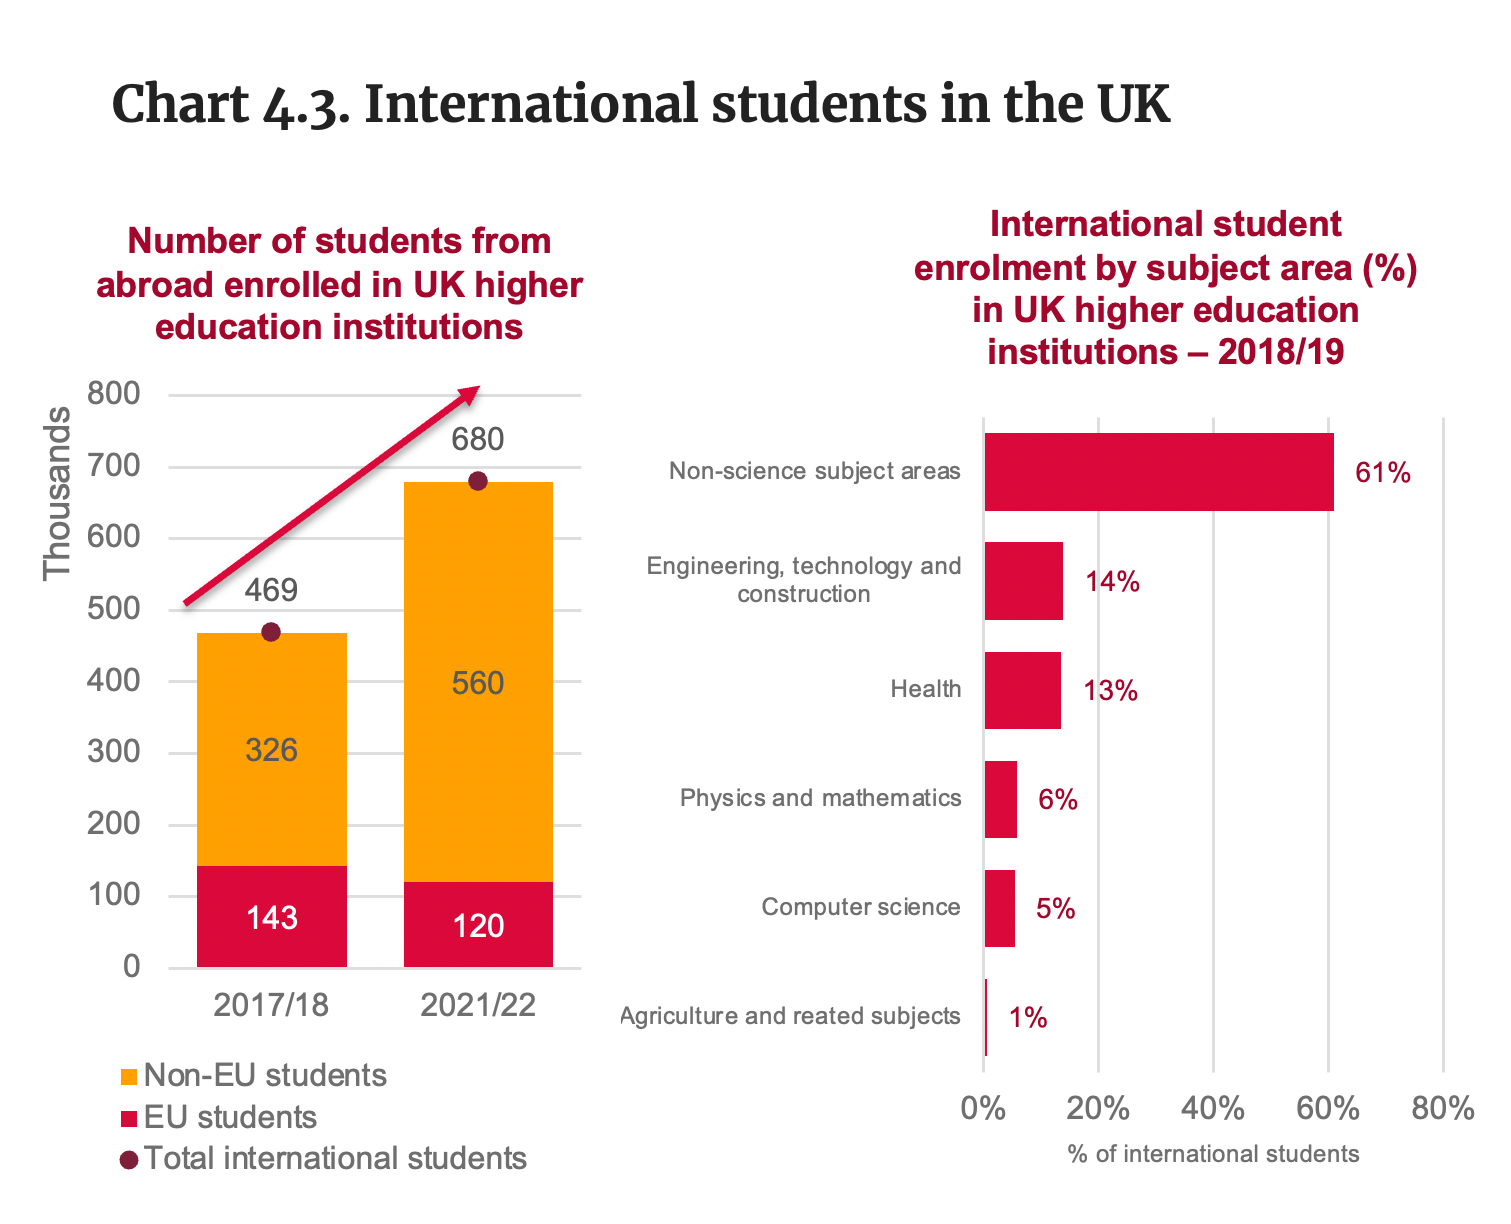
Source: HESA (2022). Figure 9 – HE student enrolment by domicile.
Source: HESA (2022). Table 22 – HE student enrolment by subject of study and domicile.
- In 2020 the share of international students enrolled in tertiary education courses in the UK was 20.1%, against an OECD average of 10.1%.[1]
- Only Luxemburg (48.8%) and Australia (26%) had a higher proportion of international tertiary students enrolled in 2020.
- The UK higher education system has been continuously attracting international students. Between the academic years of 2017/18 and 2021/22, the number of international students enrolled in the UK increased by 45%, despite the decrease in new students coming from the EU.
- For the academic year 2018/19, 61% of international students showed a preference for non-science subject areas.
- In the academic year 2018/19, the share of international students enrolled in engineering, technology and construction was 14%.
Note: [1] OECD (2023). International student mobility (indicator).
Graduates entering the workforce
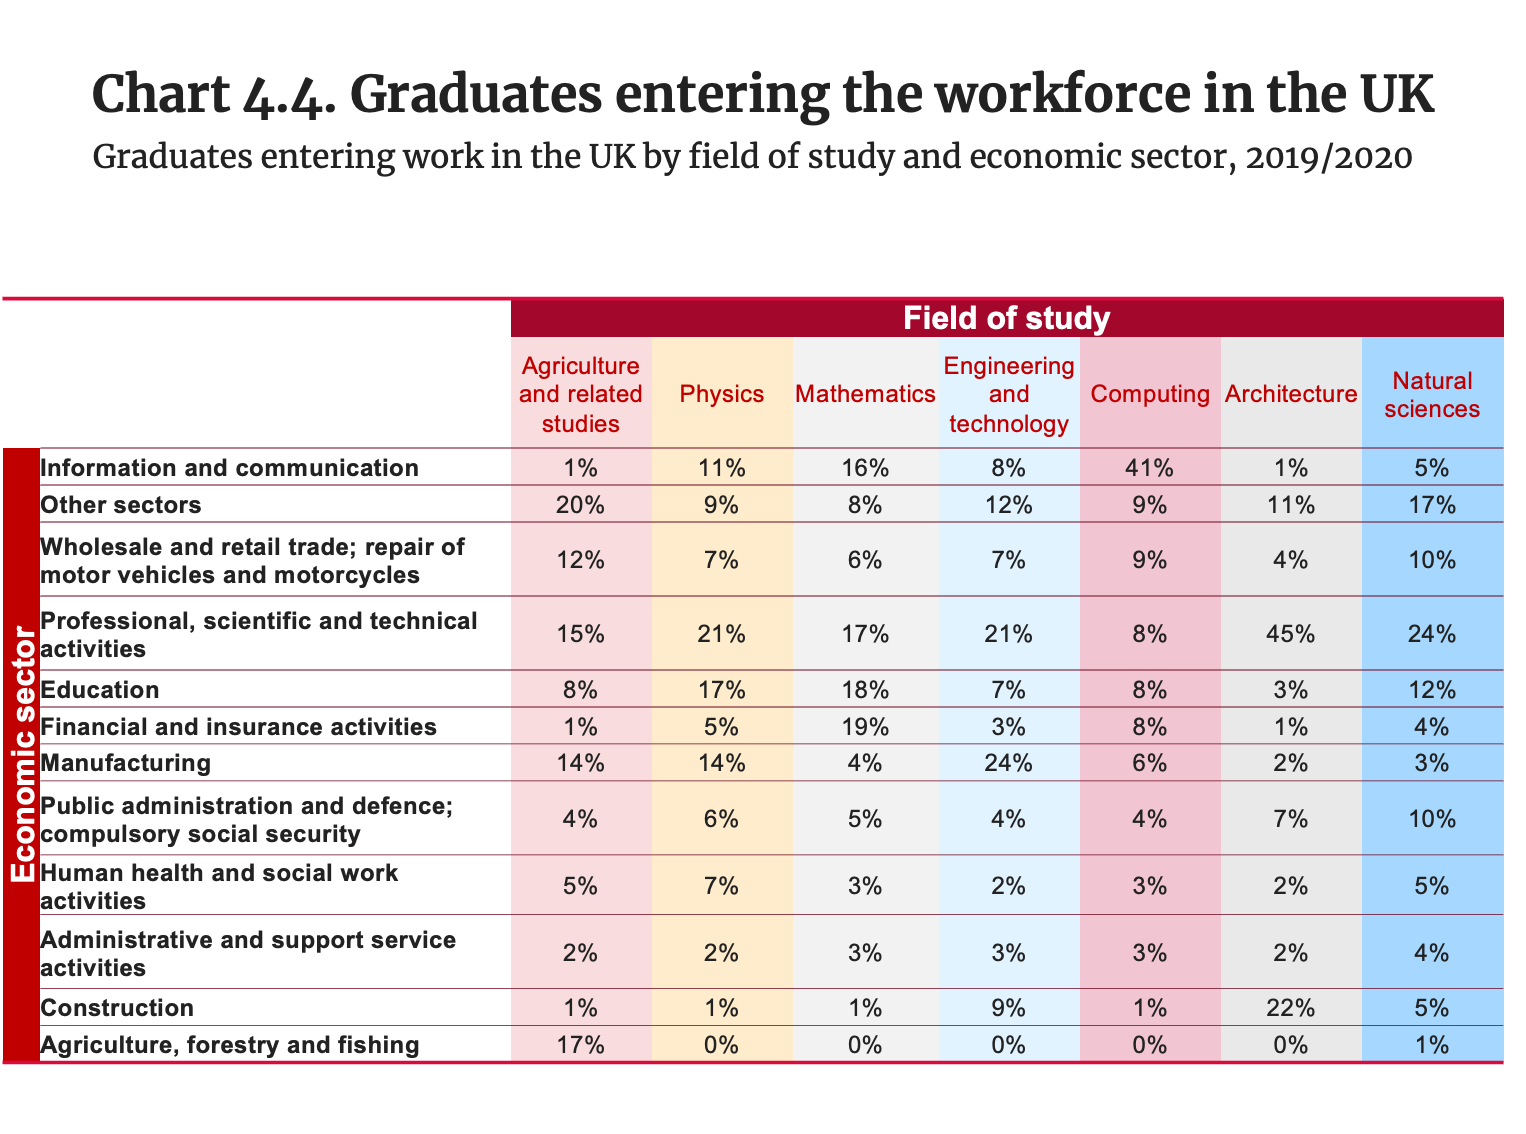
Note: Other sectors include: mining and quarrying; electricity, gas, steam and air conditioning supply; water supply; sewerage, waste management and remediation activities; transportation and storage; accommodation and food-service activities; real-estate activities; administrative and support-service activities; and arts, entertainment and recreation; other service activities; activities of households as employers; undifferentiated goods- and services-producing activities of households for own use; and the activities of extraterritorial organisations and bodies.
Source: HESA (2022). Figure 11 – standard industrial classification of graduates entering work in the UK by subject area of degree – higher education providers (HEPs) – academic year 2019/20.
The chart on the left shows which economic sectors STEM graduates entering work in the UK are employed in, by subject area of degree for the academic year 2019/20, for example:
- Engineering and technology graduates: 24% work in manufacturing; 21% in professional and scientific activities; and just 3% in finance and insurance.
- Physics graduates: 21% work in professional and scientific activities; 17% in education; 14% in manufacturing; and 11% in information and communication.
- Mathematics graduates: 19% work in finance and insurance; 18% in education; 17% in professional and scientific activities; and 16% in information and communication.
- Computing graduates: high concentration in the information and communication sector (41%).
Engineering professional salaries
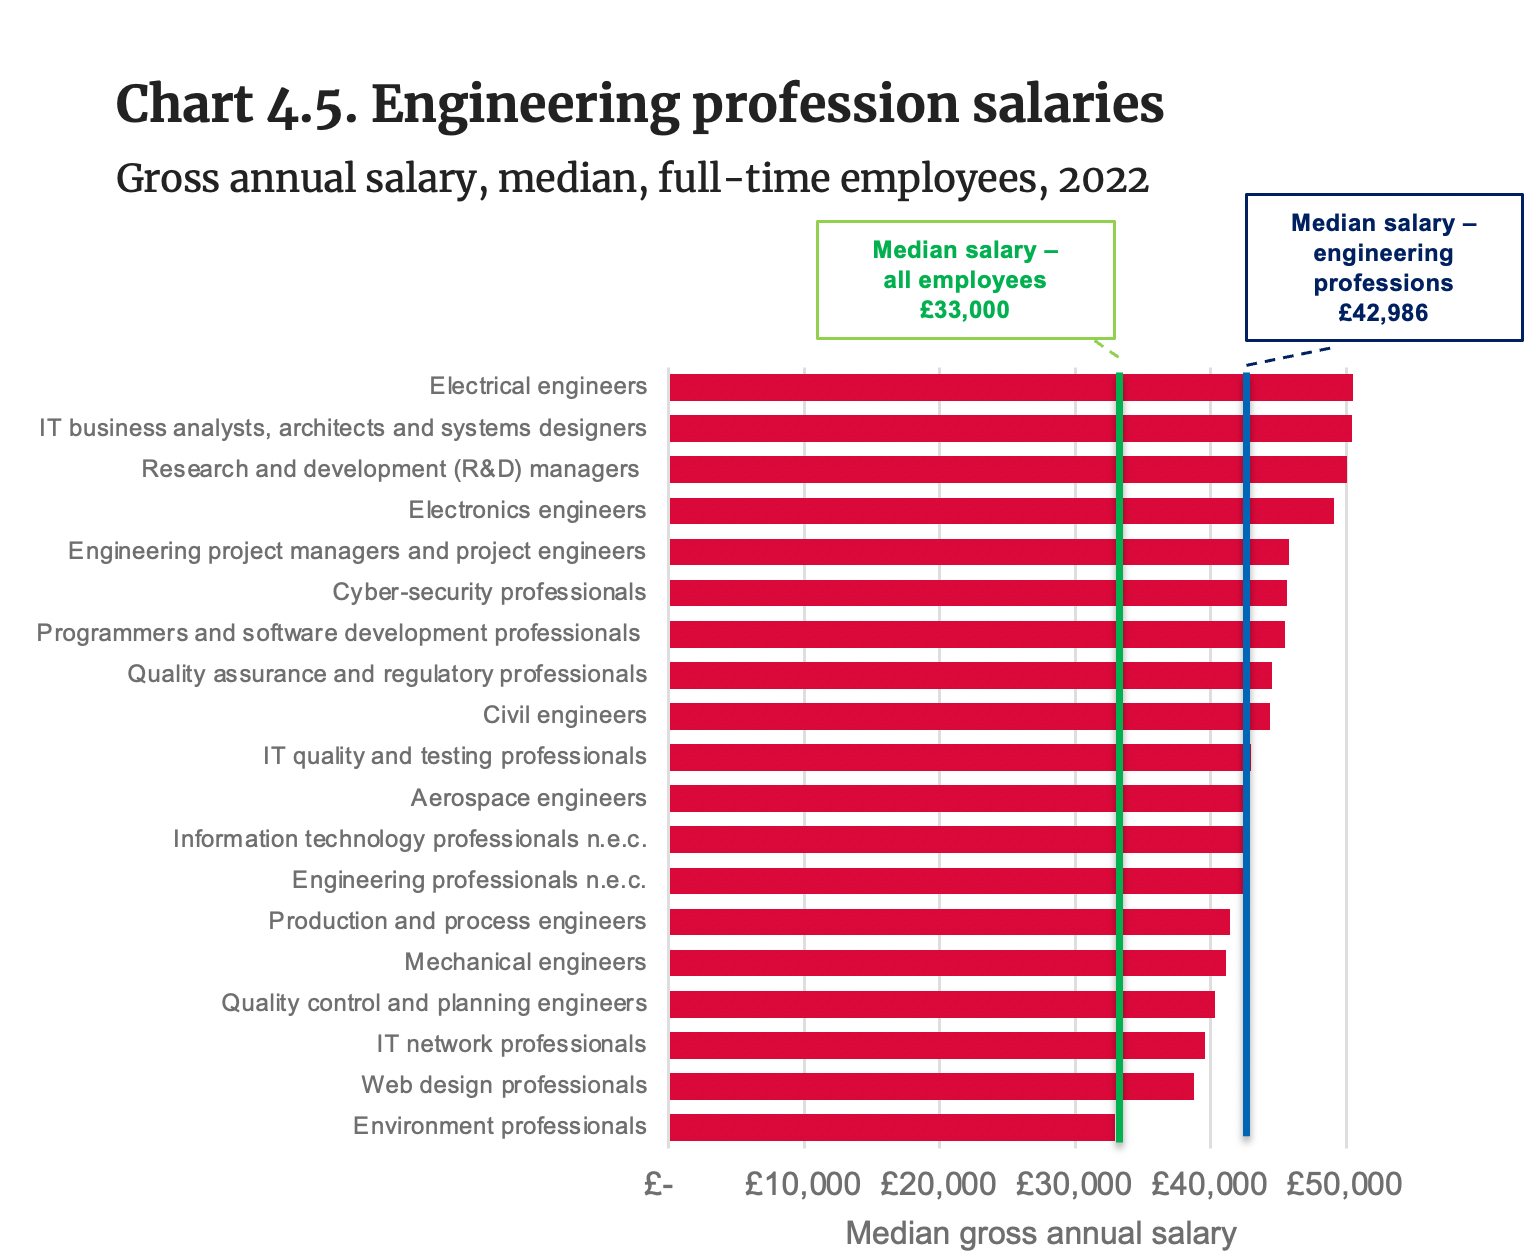
Note: Standard Occupational Classification (SOC) codes for the engineering professions are based on Engineering UK (2018). The State of Engineering 2018; SOC2010 Codes were updated to SOC2020 Codes based on ONS (2022). SOC 2020 Volume 2: the coding index and coding rules and conventions.
Source: ONS (2022). Annual Survey of Hours and Earnings (ASHE) – Table 14.7a.
- In 2022 the median salaries for engineering occupations in the UK were higher than the average in the job market.
- In 2022 the median for engineering professionals’ gross annual salaries was £42,986, against £33,000 of all UK workers.
Researchers by sector of employment
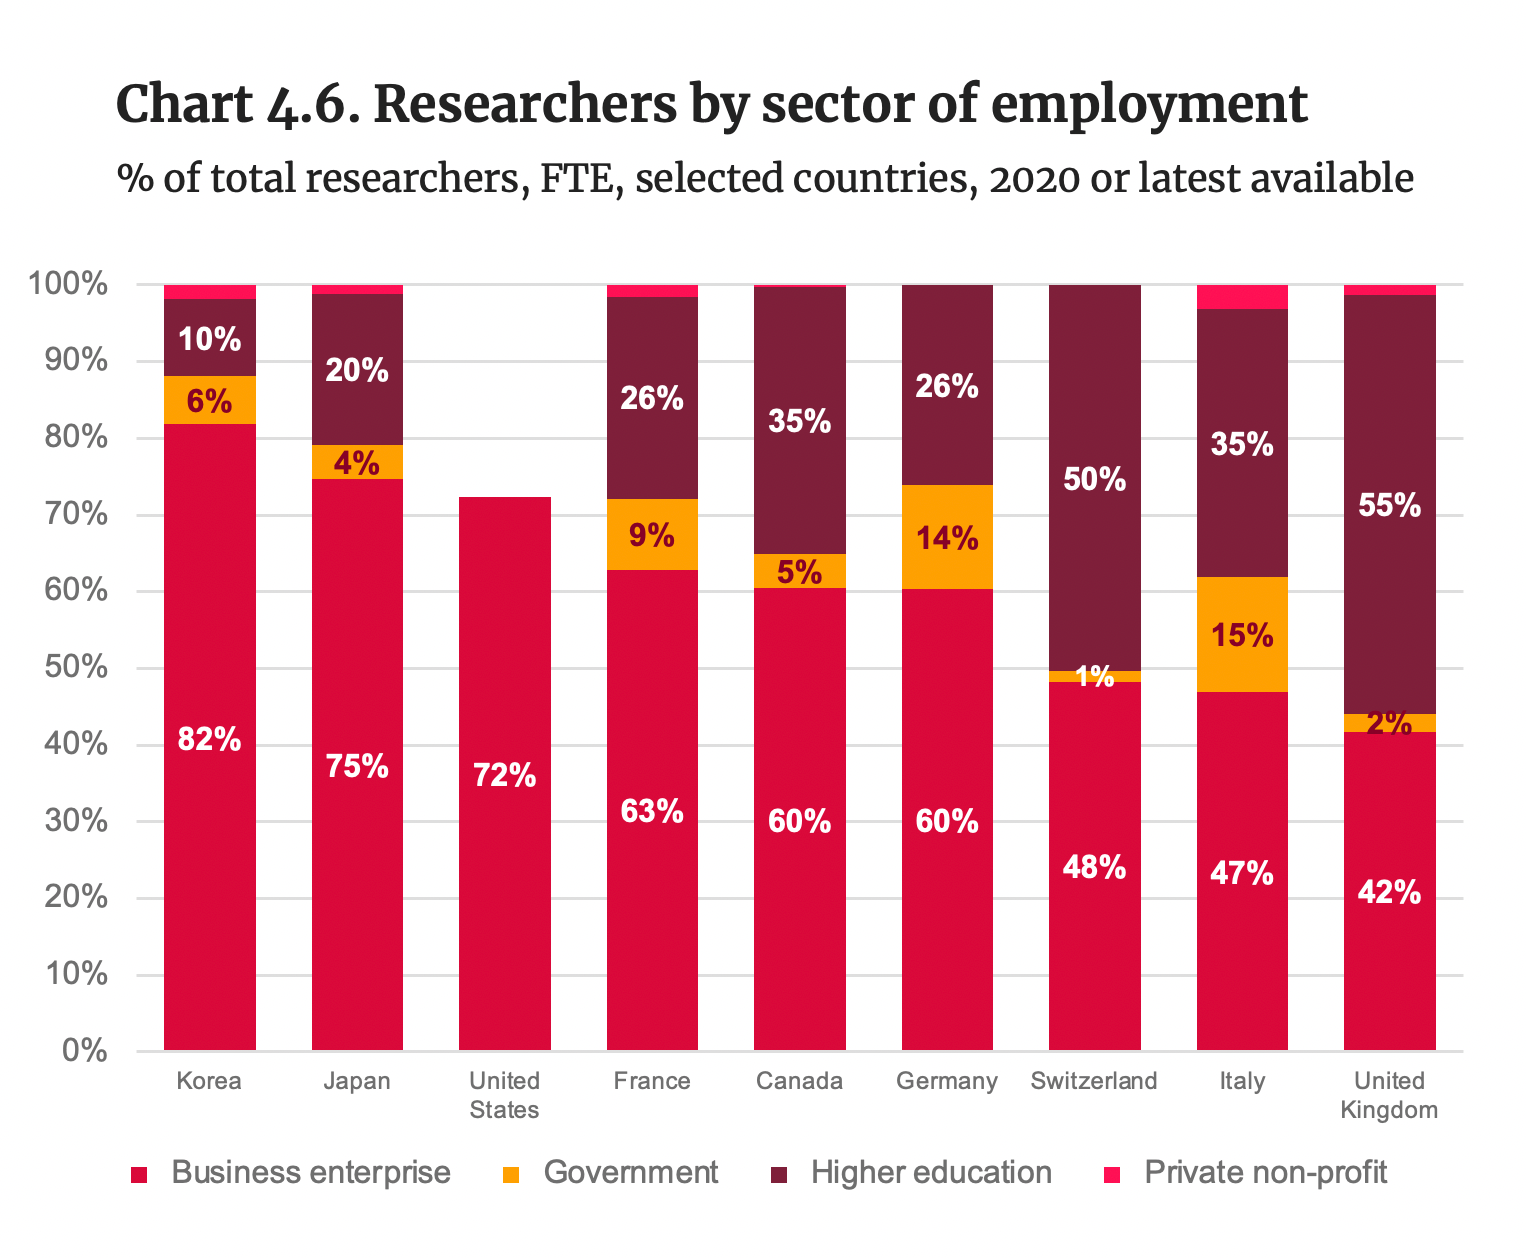
Note: For Switzerland, the UK and the US, data refers to 2019; for the US, data is only available for business enterprises.
Source: OECD (2022). R&D personnel by sector and function database.
- Compared to key competitor countries, the UK has a relatively low share of researchers working in the business sector.
- In 2020 the business sector in the UK employed 42% of researchers, below the share employed by Korea (82%), Japan (75%) and the US (72%) but also below countries such as France (63%) and Germany (60%).
- Roughly 2% of UK researchers worked in the government sector in 2020, below comparator countries such as Italy (15%), Germany (14%) and France (9%).
- The UK stands out for the share of researchers working in higher education (55%), the highest among comparator countries, followed by Switzerland (50%), Canada (35%) and Italy (35%).
Women researchers
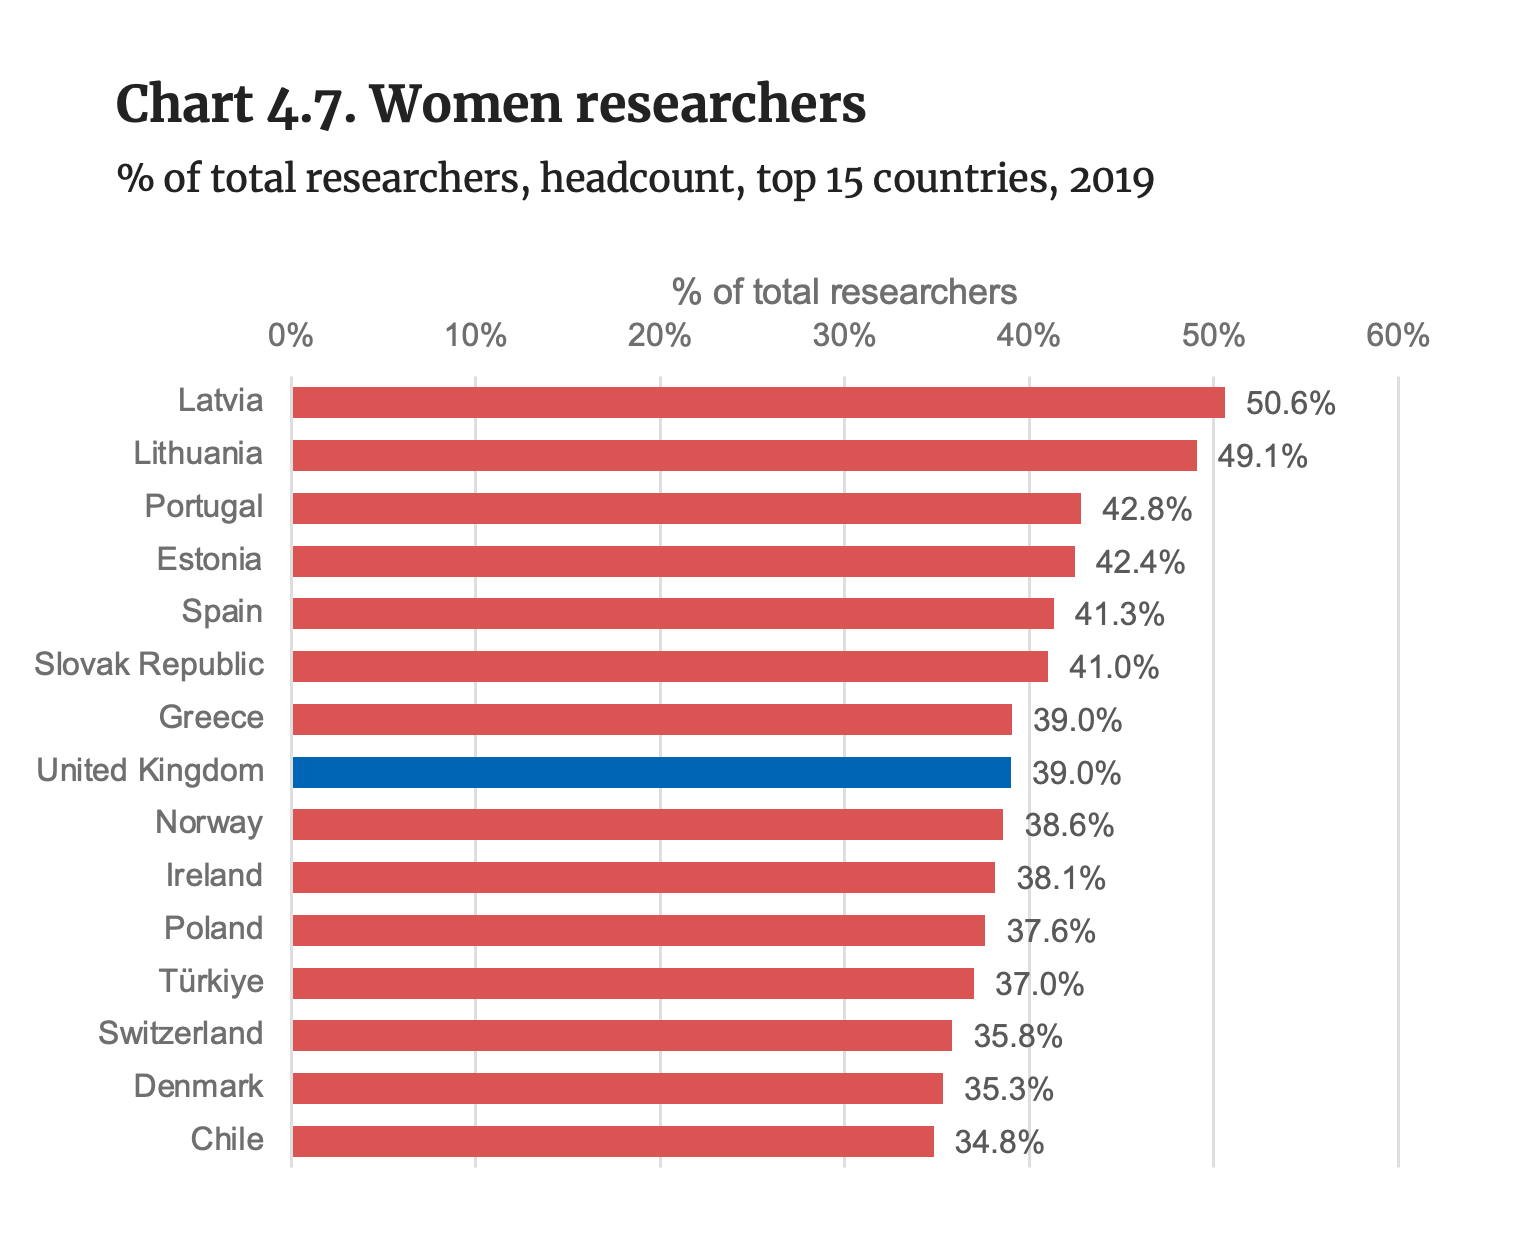
Note: Data for the US not available.
Source: OECD (2022). Main Science and Technology Indicators.
- In 2019 the UK had a relatively high share of women researchers, featuring in eighth place among OECD countries where data is available.


